We are happy to offer this national summary of market trends for both the office and industrial sectors, per CoStar’s statistics. Below is the office report and next week we will have the industrial report. You can click within this article to reach your specific interests below. Please contact us if you want any additional information.
The Office Market Overview
Table of Contents – Click for your interested cities/areas via this alpha list
A | B | C | D | E | F | G | H | I | J | K | L | M | N | O | P | Q | R | S | T | U | V | W | X | Y | Z
Inventory & Development Graphs
The Office Market Overview
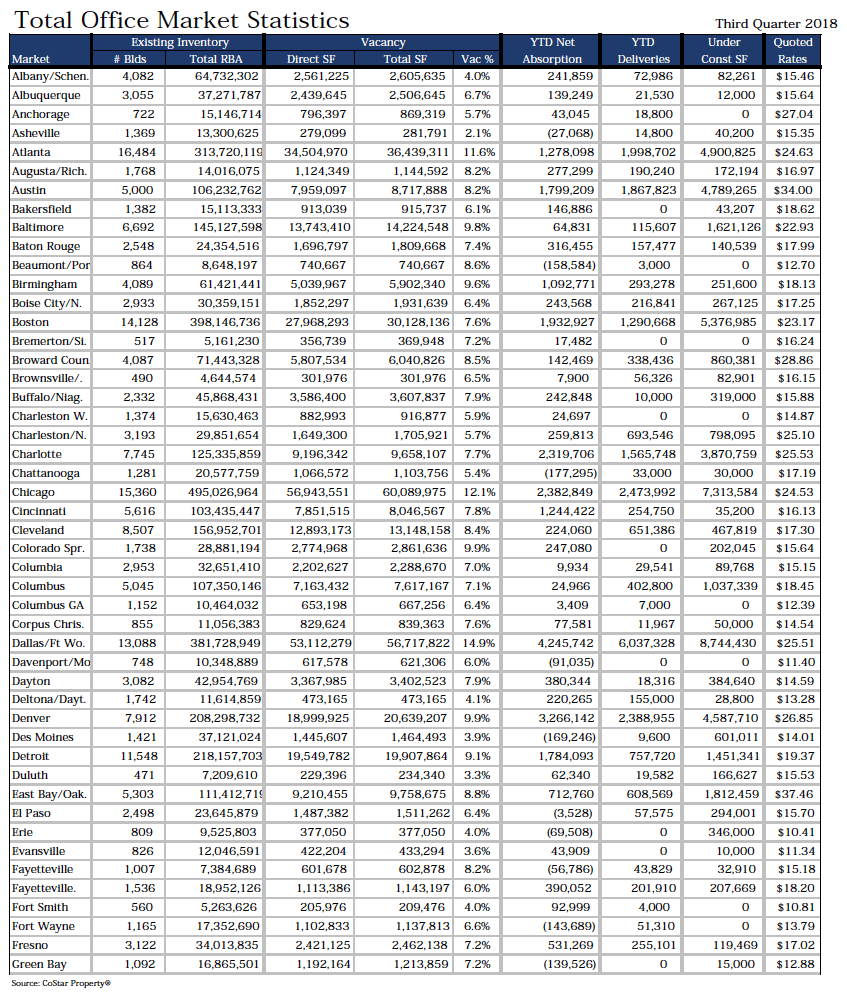
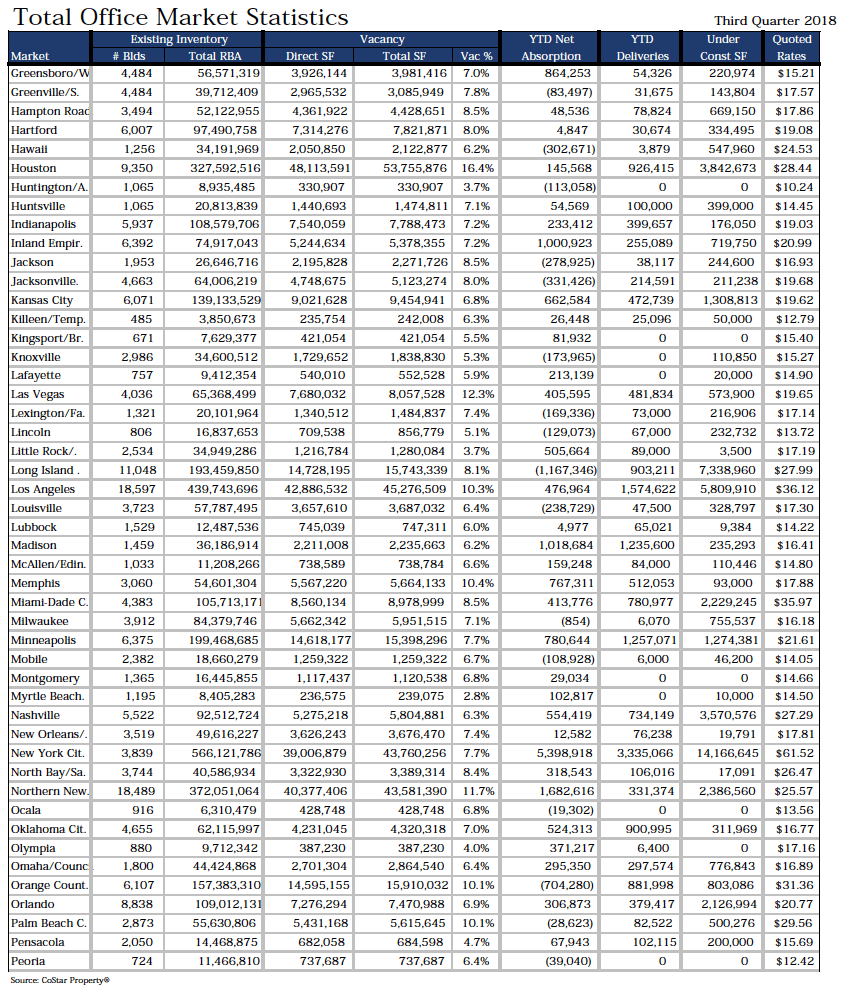
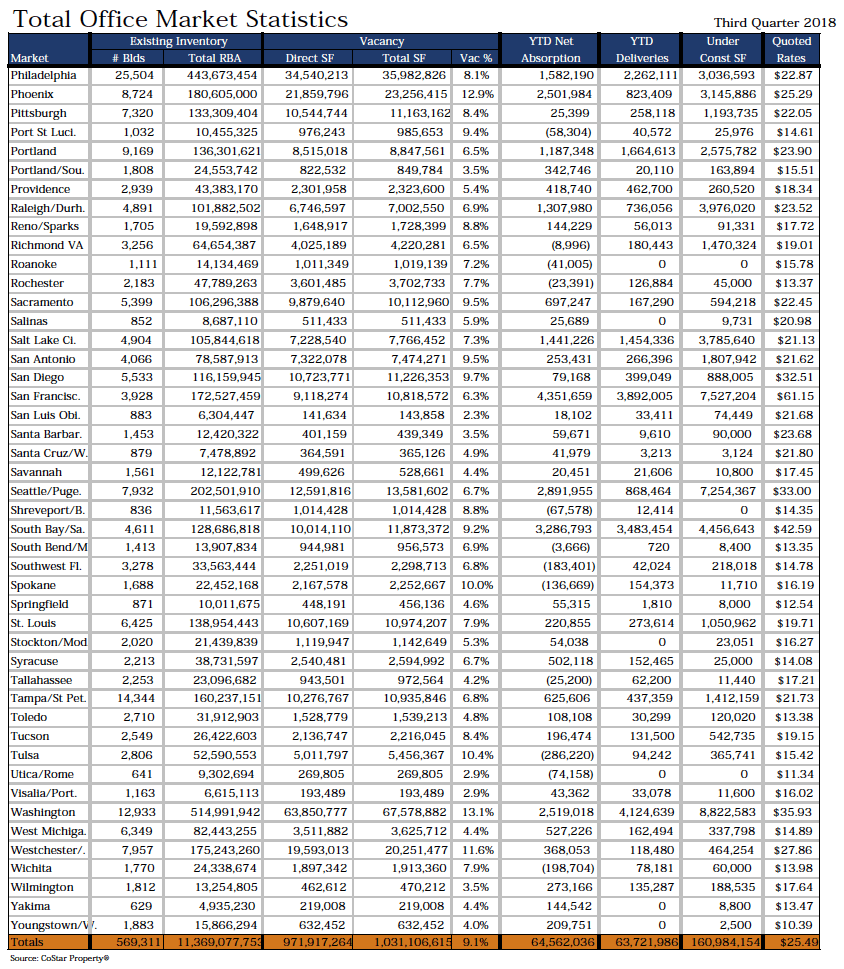
Vacancy Stays at 9.1% | Net Absorption Positive 20,779,962
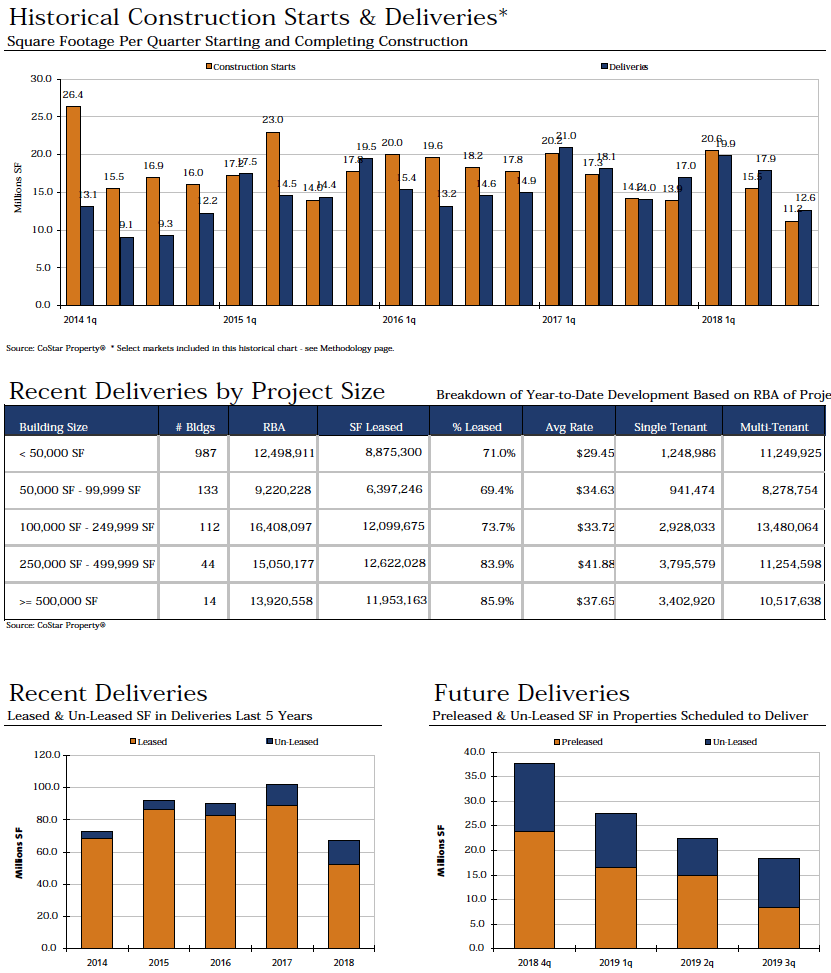
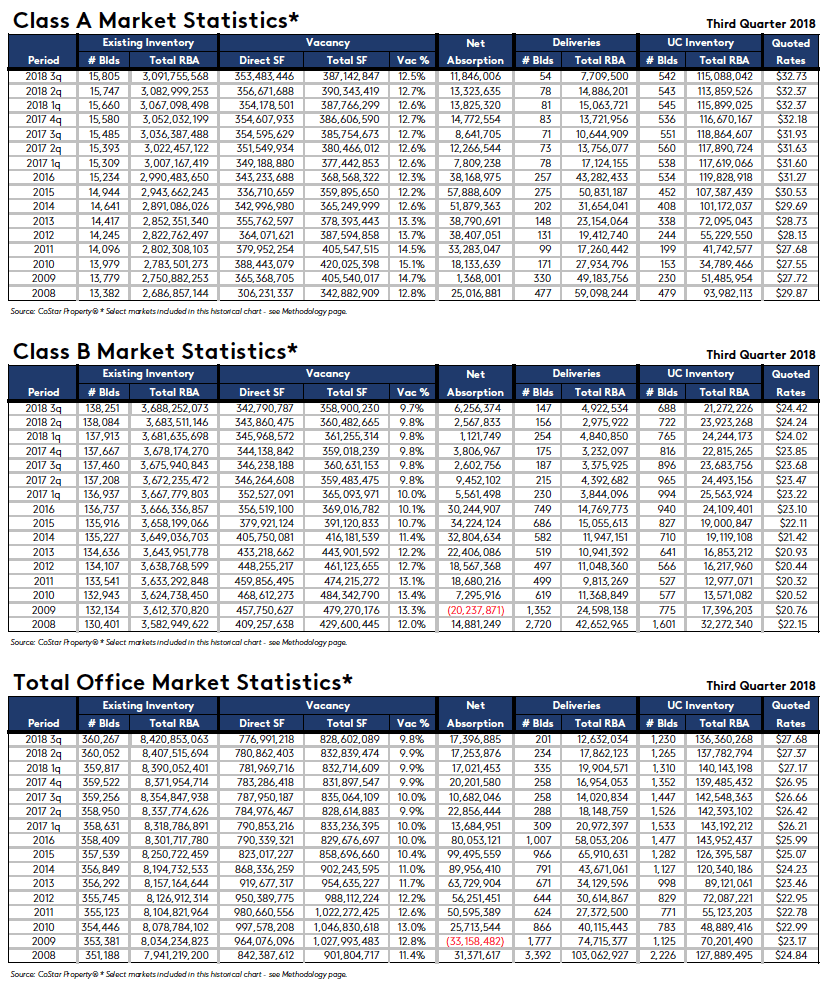
The U.S. Office market ended the third quarter 2018 with a vacancy rate of 9.1%. The vacancy rate was unchanged over the previous quarter, with net absorption totaling positive 20,779,962 square feet in the third quarter. Vacant sublease space decreased in the quarter, ending the quarter at 59,189,351 square feet. Rental rates ended the third quarter at $25.49, an increase over the previous quarter. A total of 296 buildings delivered to the market in the quarter totaling 16,277,264 square feet, with 160,984,154 square feet still under construction at the end of the quarter.
Absorption
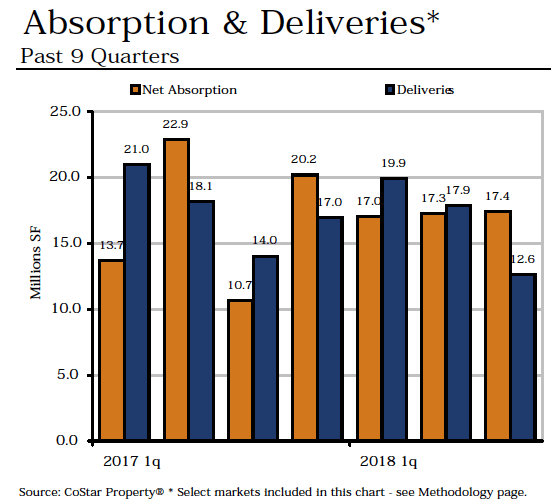
Net absorption for the overall U.S. office market was positive 20,779,962 square feet in the third quarter 2018. That compares to positive 23,281,764 square feet in the second quarter 2018, positive 20,500,310 square feet in the first quarter 2018, and positive 27,387,508 square feet in the fourth quarter 2017.
The Class-A office market recorded net absorption of positive 12,736,209 square feet in the third quarter 2018, compared to positive 16,386,314 square feet in the second quarter 2018, positive 17,322,244 in the first quarter 2018, and positive 18,200,413 in the fourth quarter 2017.
The Class-B office market recorded net absorption of positive 8,078,538 square feet in the third quarter 2018, compared to positive 4,525,338 square feet in the second quarter 2018, positive 852,608 in the first quarter 2018, and positive 7,294,992 in the fourth quarter 2017.
The Class-C office market recorded net absorption of negative (34,785) square feet in the third quarter 2018 compared to positive 2,370,112 square feet in the second quarter 2018, positive 2,325,458 in the first quarter 2018, and positive 1,892,103 in the fourth quarter 2017.
Net absorption for U.S.’s central business district was positive 4,158,171 square feet in the third quarter 2018. That compares to positive 6,455,736 square feet in the second quarter 2018, positive 7,971,332 in the first quarter 2018, and positive 5,099,477 in the fourth quarter 2017. Net absorption for the suburban markets was positive 16,621,791 square feet in the third quarter 2018. That compares to positive 16,826,028 square feet in second quarter 2018, positive 12,528,978 in the first quarter 2018, and positive 22,288,031 in the fourth quarter 2017.
Vacancy
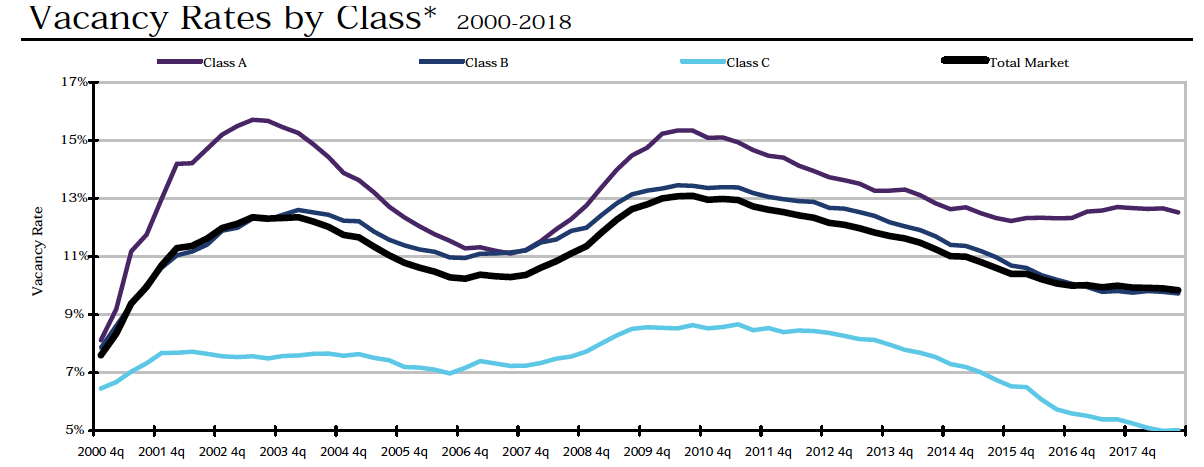
The office vacancy rate in the U.S. market area remained at 9.1% at the end of the third quarter 2018. The vacancy rate was 9.1% at the end of the second quarter 2018, 9.2% at the end of the first quarter 2018, and 9.2% at the end of the fourth quarter 2017.
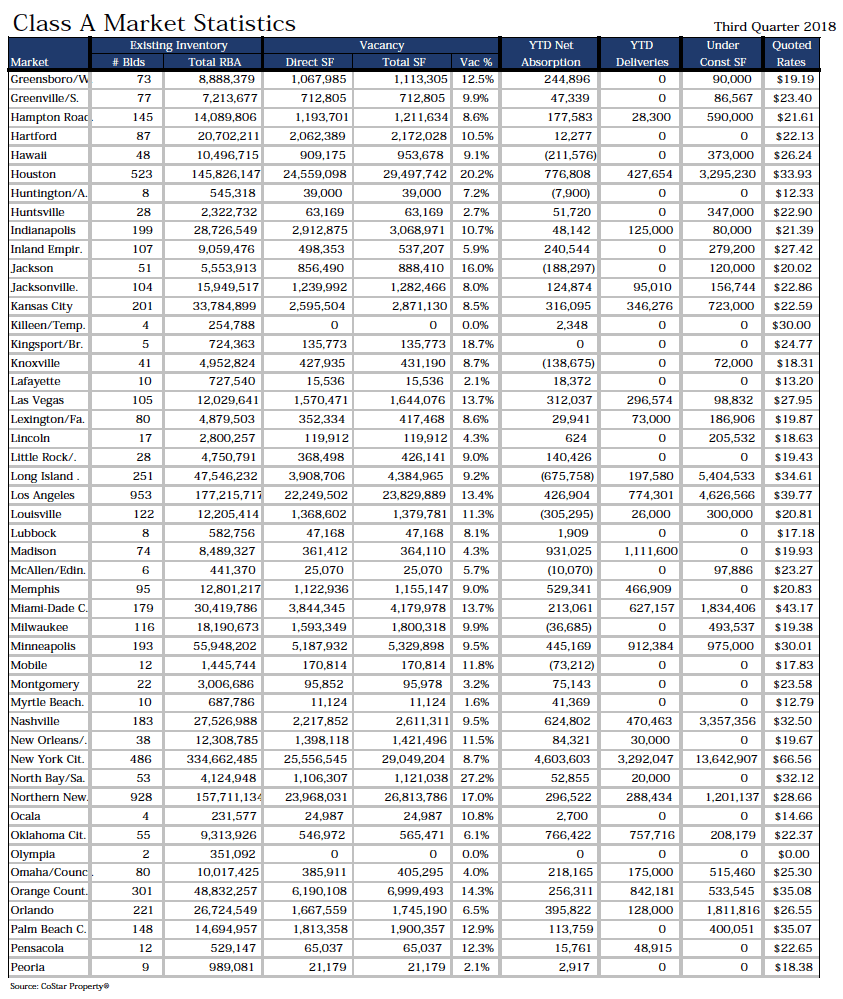
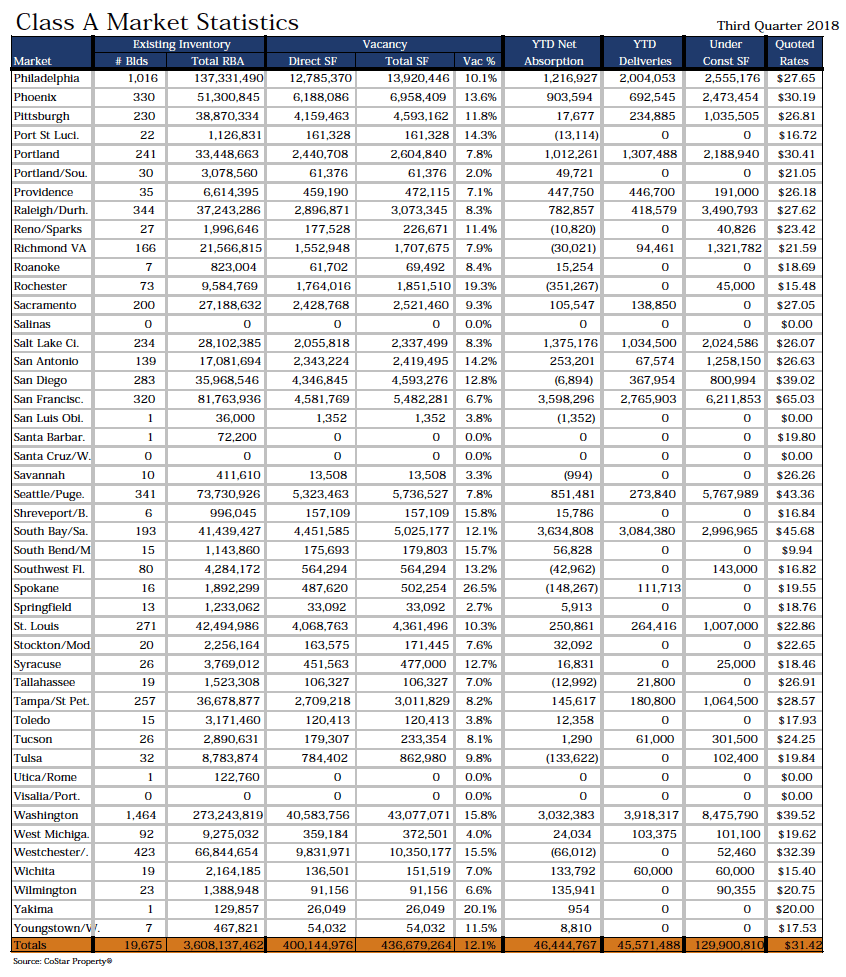
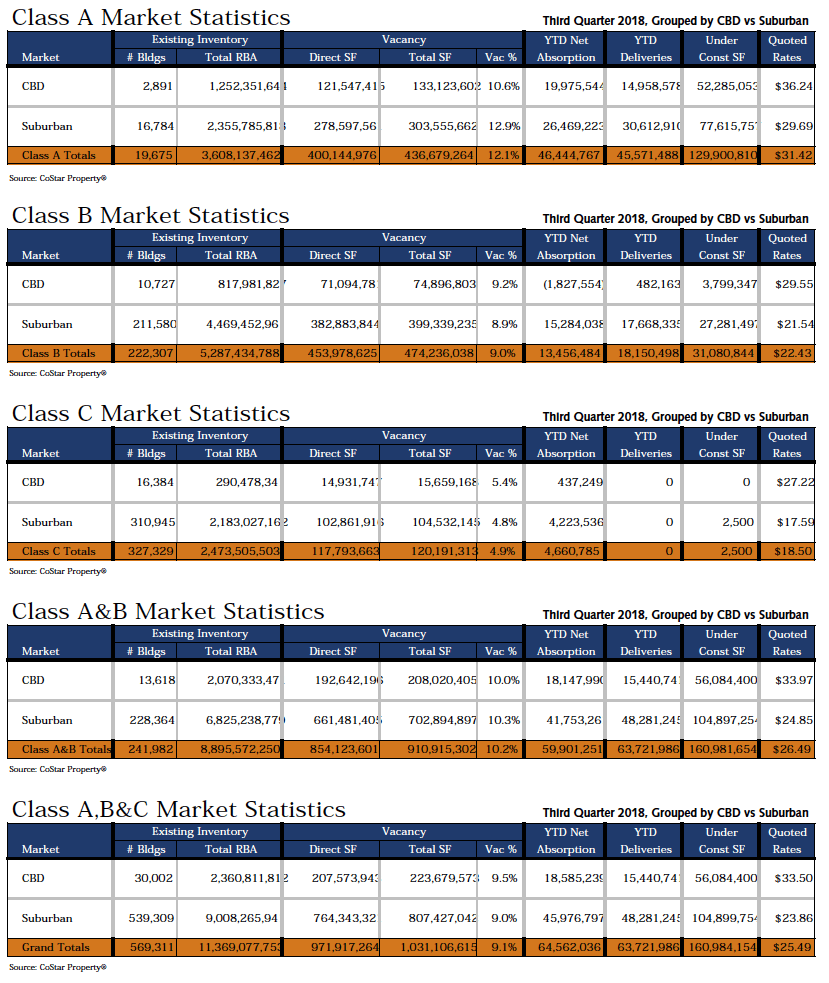
Class-A projects reported a vacancy rate of 12.1% at the end of the third quarter 2018, 12.2% at the end of the second quarter 2018, 12.2% at the end of the first quarter 2018, and 12.3% at the end of the fourth quarter 2017.
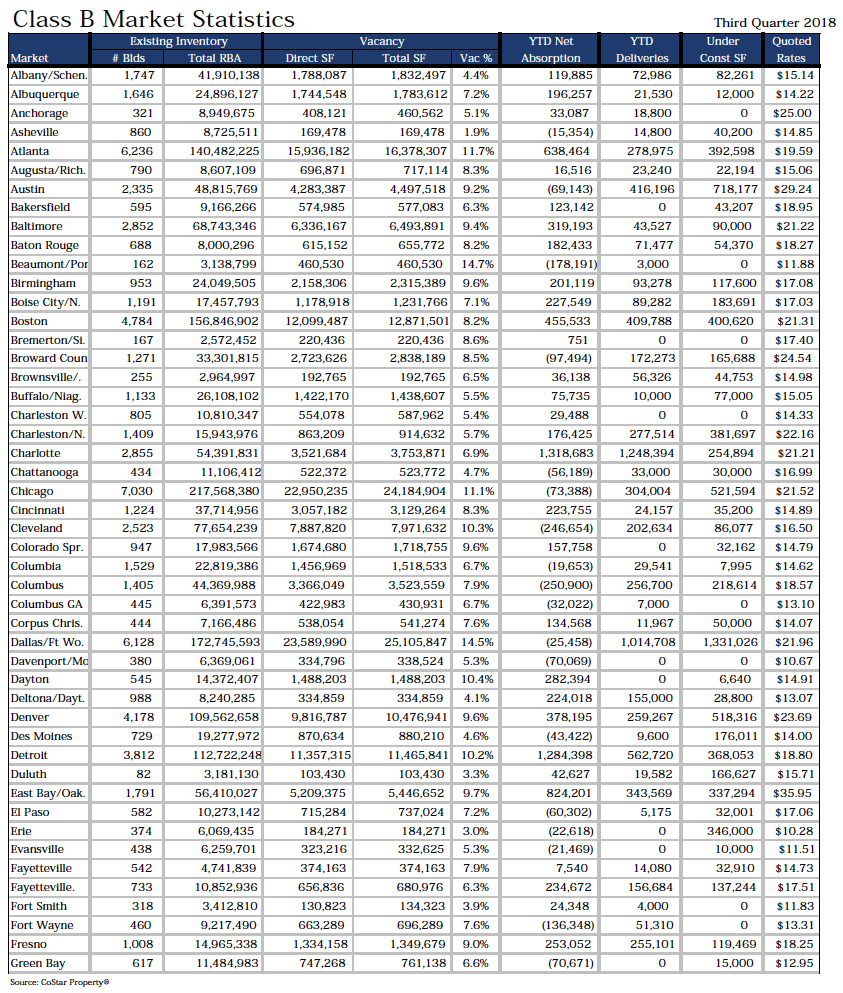
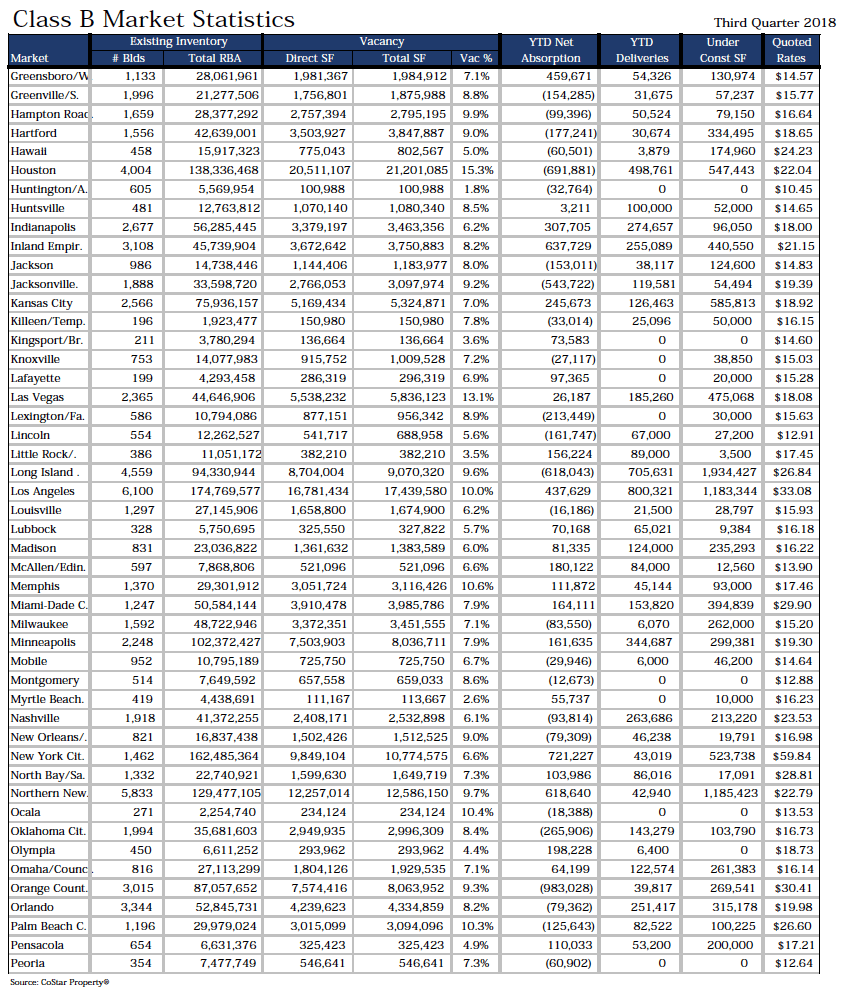
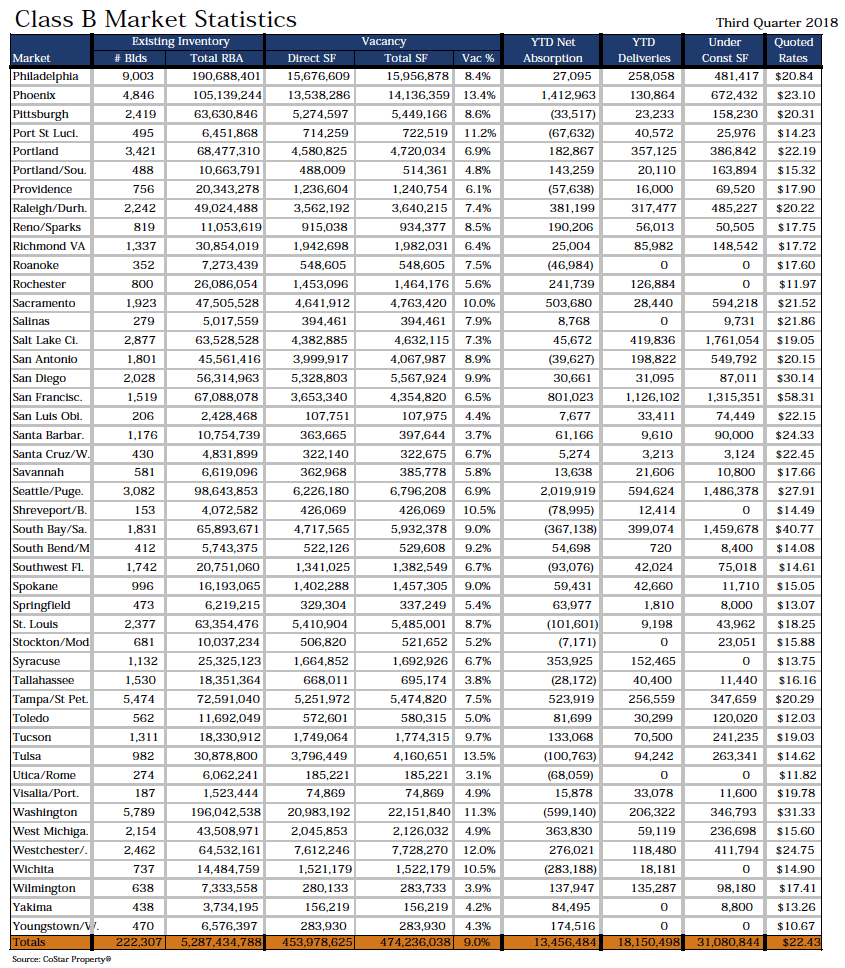
Class-B projects reported a vacancy rate of 9.0% at the end of the third quarter 2018, 9.0% at the end of the second quarter 2018, 9.0% at the end of the first quarter 2018, and 9.0% at the end of the fourth quarter 2017.
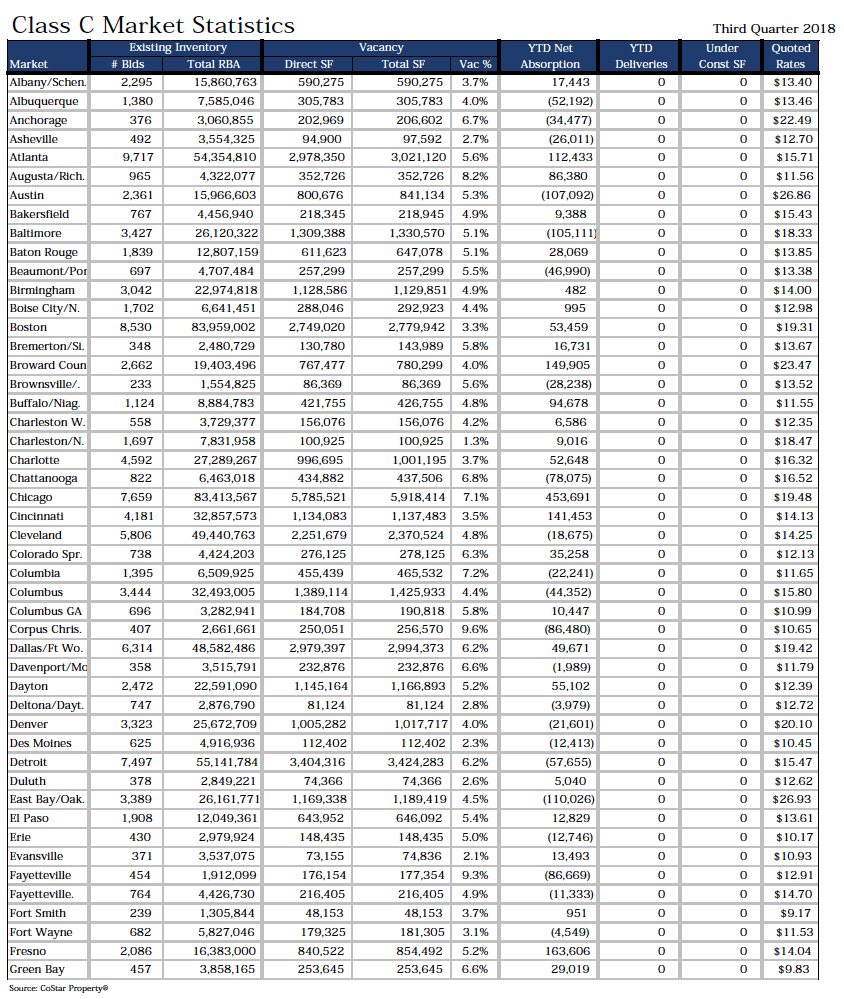
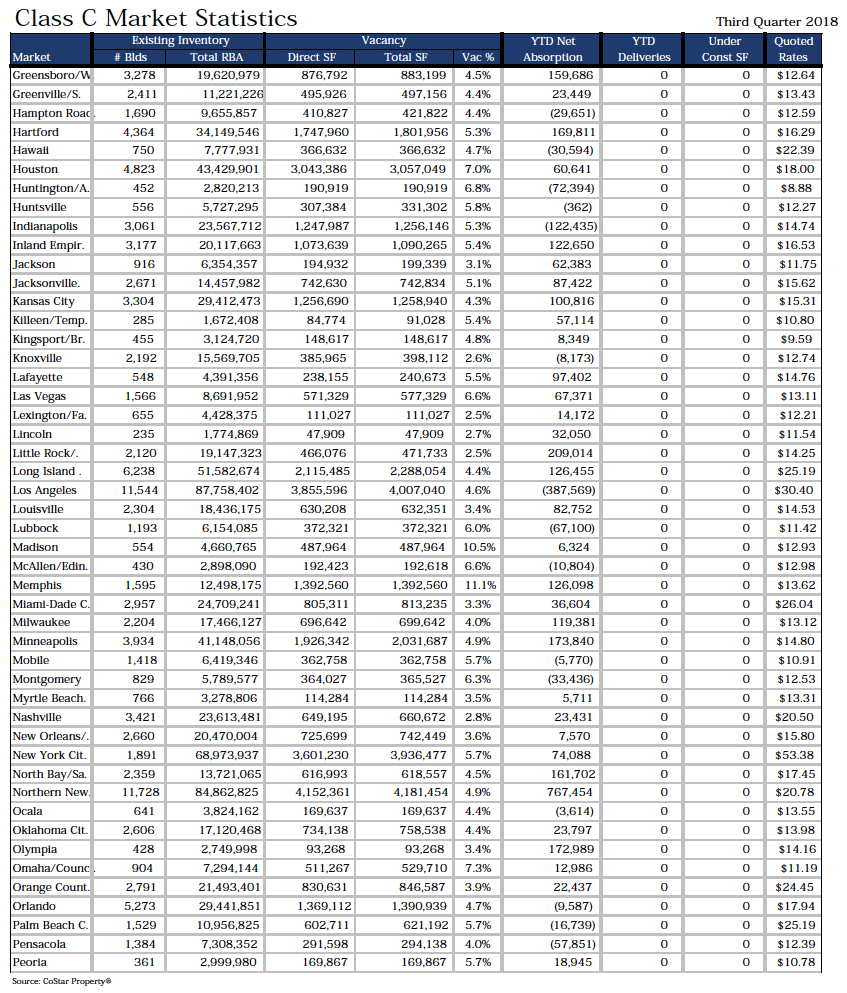
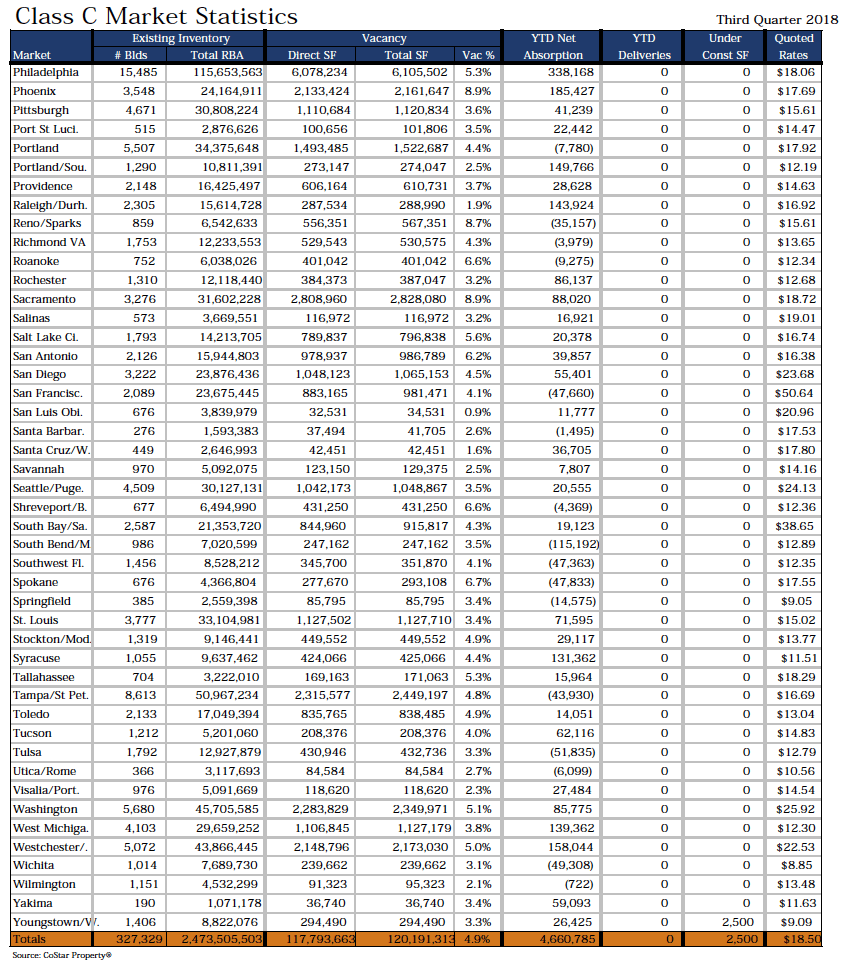
Class-C projects reported a vacancy rate of 4.9% at the end of the third quarter 2018, 4.9% at the end of second quarter 2018, 5.0% at the end of the first quarter 2018, and 5.1% at the end of the fourth quarter 2017.
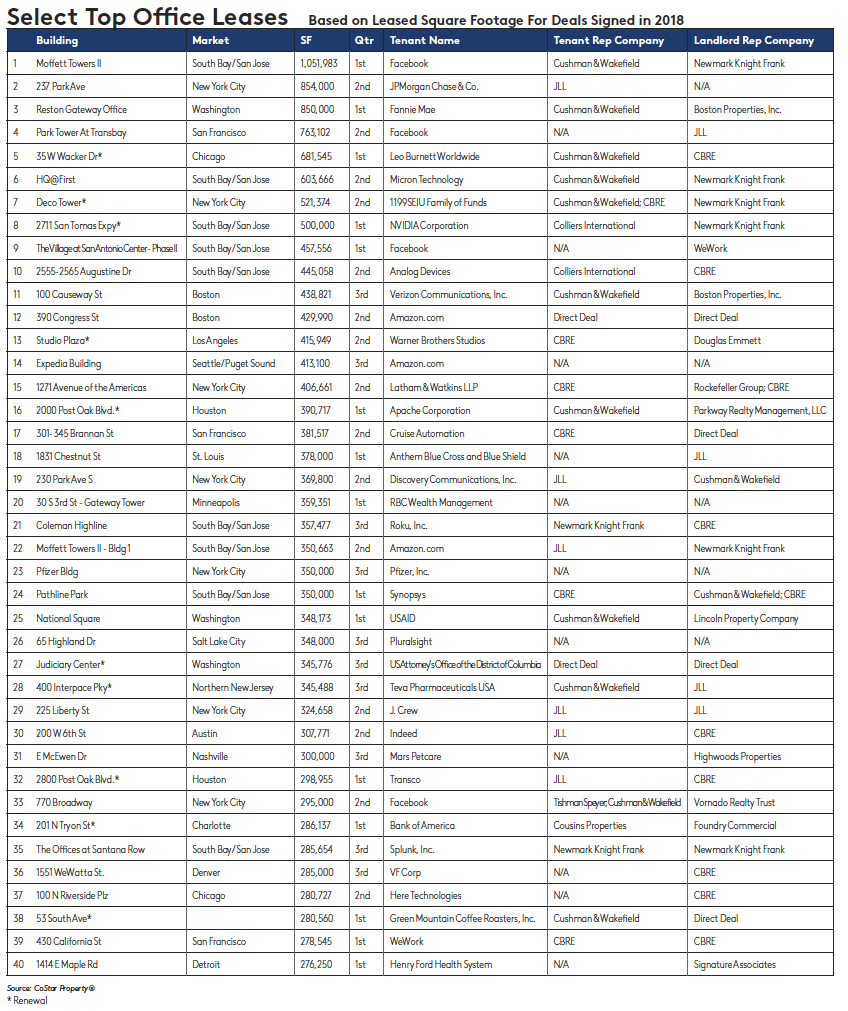
The overall vacancy rate in U.S.’s central business district at the end of the third quarter 2018 decreased to 9.5%. The vacancy rate was 9.6% at the end of the second quarter 2018, 9.6% at the end of the first quarter 2018, and 9.8% at the end of the fourth quarter 2017. The vacancy rate in the suburban markets changed to 9.0% in the third quarter 2018. The vacancy rate was 9.0% at the end of the second quarter 2018, 9.0% at the end of the first quarter 2018, and 9.0% at the end of the fourth quarter 2017. Largest Lease Signings The largest lease signings occurring in 2018 included: the 521,374-square-foot lease signed by 1199SEIU Family of Funds at Deco Tower in the New York City market; the 429,990-square-foot deal signed by Amazon.com at 390 Congress St in the Boston market; and the 413,100-square-foot lease signed by Amazon.com at Expedia Building (333 108th Ave NE) in the W Seattle/Puget Sound market.
Sublease Vacancy
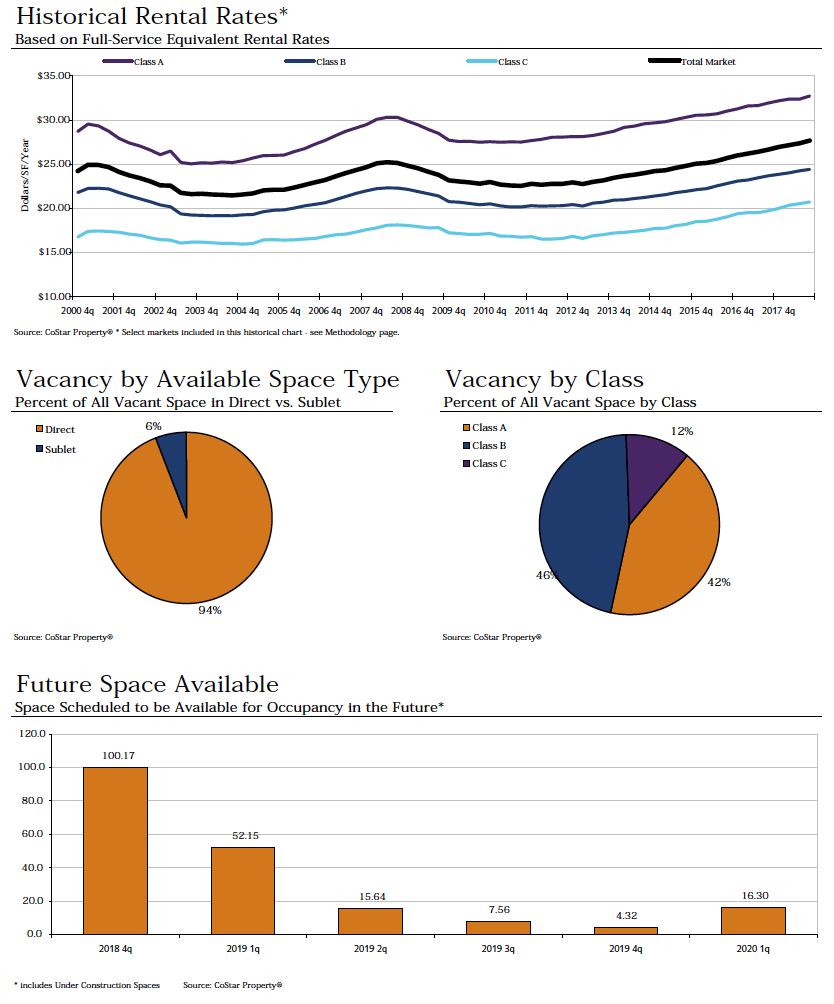
The amount of vacant sublease space in the U.S. market decreased to 59,189,351 square feet by the end of the third quarter 2018, from 59,384,414 square feet at the end of the second quarter 2018. There was 57,313,166 square feet vacant at the end of the first quarter 2018 and 54,915,272 square feet at the end of the fourth quarter 2017.
U.S.’s Class-A projects reported vacant sublease space of 36,534,288 square feet at the end of third quarter 2018, down from the 36,539,376 square feet reported at the end of the second quarter 2018. There were 36,140,225 square feet of sublease space vacant at the end of the first quarter 2018, and 34,373,896 square feet at the end of the fourth quarter 2017.
Class-B projects reported vacant sublease space of 20,257,413 square feet at the end of the third quarter 2018, down from the 20,491,138 square feet reported at the end of the second quarter 2018. At the end of the first quarter 2018 there were 18,682,129 square feet, and at the end of the fourth quarter 2017 there were 18,141,733 square feet vacant.
Class-C projects reported increased vacant sublease space from the second quarter 2018 to the third quarter 2018. Sublease vacancy went from 2,353,900 square feet to 2,397,650 square feet during that time. There was 2,490,812 square feet at the end of the first quarter 2018, and 2,399,643 square feet at the end of the fourth quarter 2017.
Sublease vacancy in U.S.’s central business district stood at 16,105,630 square feet at the end of the third quarter 2018. It was 16,155,915 square feet at the end of the second quarter 2018, 16,257,939 square feet at the end of the first quarter 2018, and 16,117,189 square feet at the end of the fourth quarter 2017.
Sublease vacancy in the suburban markets ended the third quarter 2018 at 43,083,721 square feet. At the end of the second quarter 2018 sublease vacancy was 43,228,499 square feet, was 41,055,227 square feet at the end of the first quarter 2018, and was 38,798,083 square feet at the end of the fourth quarter 2017.
Rental Rates
The average quoted asking rental rate for available office space, all classes, was $25.49 per square foot per year at the end of the third quarter 2018 in the U.S. market area. This represented a 1.1% increase in quoted rental rates from the end of the second quarter 2018, when rents were reported at $25.21 per square foot.
The average quoted rate within the Class-A sector was $31.42 at the end of the third quarter 2018, while Class-B rates stood at $22.43, and Class-C rates at $18.50. At the end of the second quarter 2018, Class-A rates were $31.11 per square foot, Class-B rates were $22.26, and Class-C rates were $18.35.
The average quoted asking rental rate in U.S.’s CBD was $33.50 at the end of the third quarter 2018, and $23.86 in the suburban markets. In the second quarter 2018, quoted rates were $32.85 in the CBD and $23.67 in the suburbs.
Deliveries and Construction
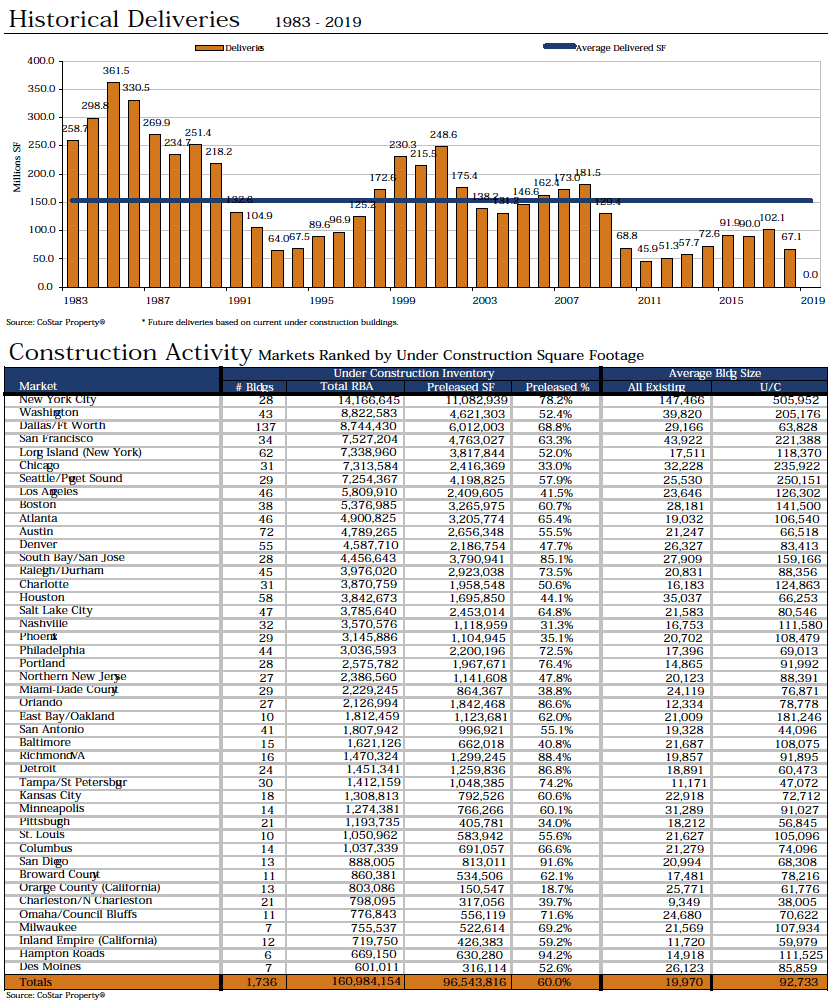
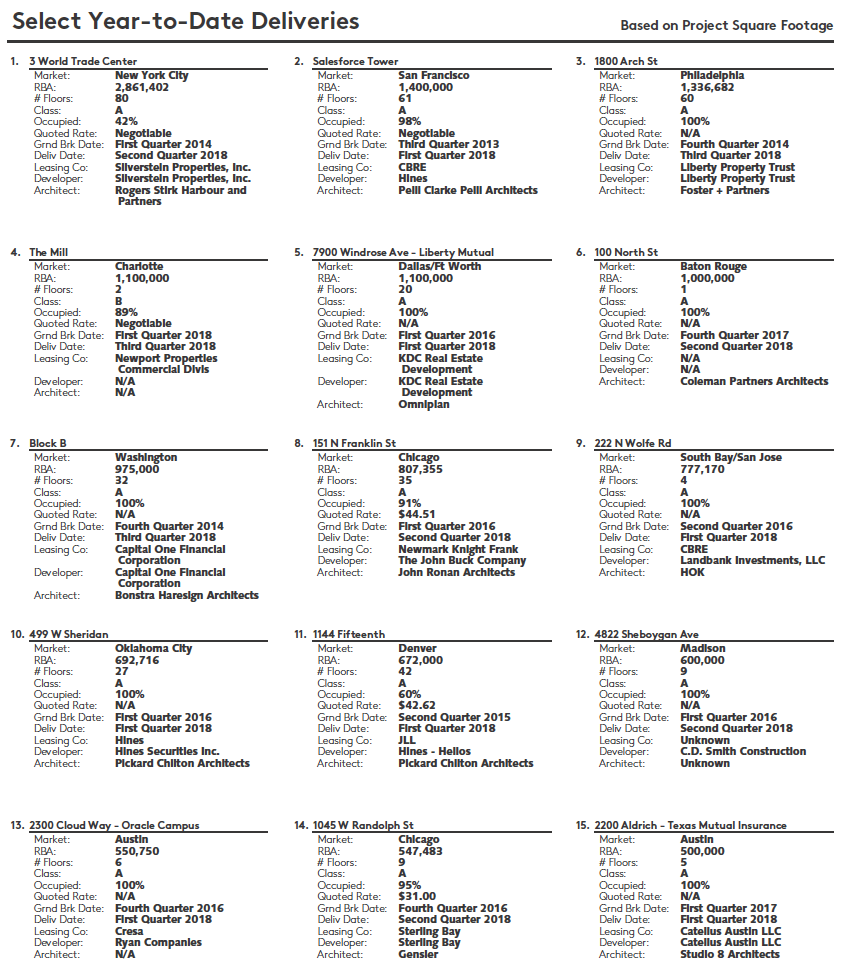
During the third quarter 2018, 296 buildings totaling 16,277,264 square feet were completed in the U.S. market area. This compares to 384 buildings totaling 23,052,788 square feet that were completed in the second quarter 2018, 497 buildings totaling 24,391,934 square feet completed in the first quarter 2018, and 22,653,988 square feet in 435 buildings completed in the fourth quarter 2017.
There were 160,984,154 square feet of office space under construction at the end of the third quarter 2018.
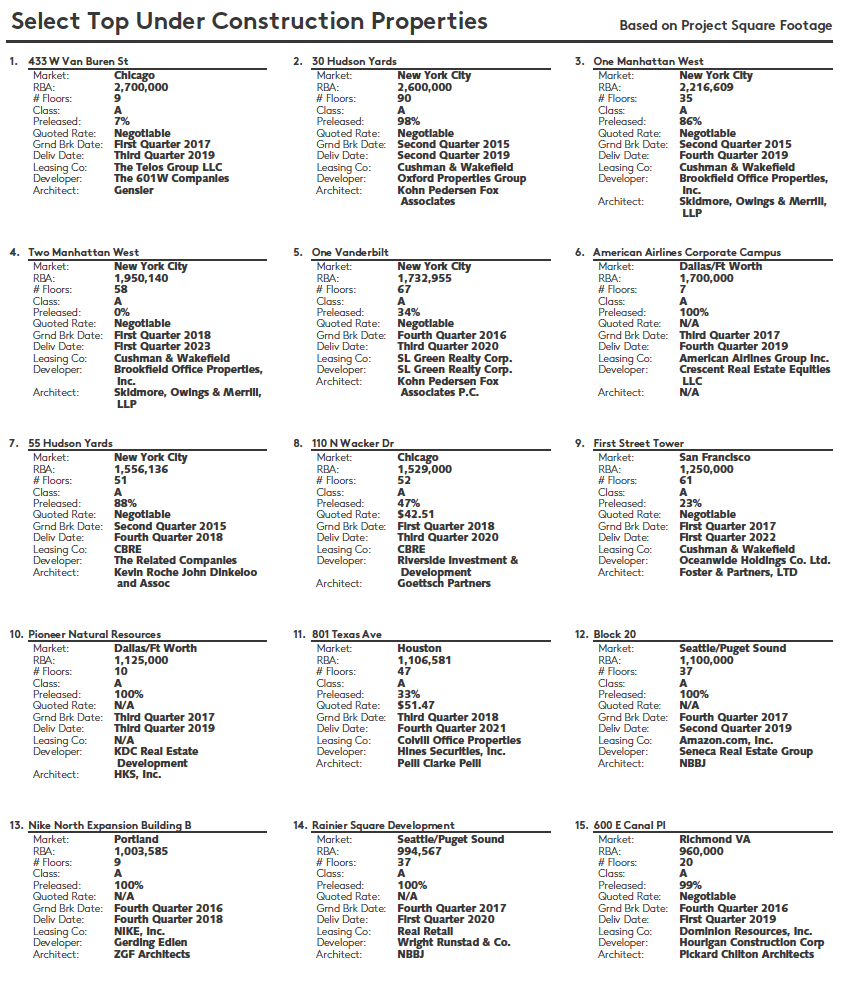
Some of the notable 2018 deliveries include: 3 World Trade Center, a 2,861,402-square-foot facility in the New York City market that delivered in second quarter 2018 and is now 42% occupied, and Salesforce Tower, a 1,400,000-square-foot building that delivered in first quarter 2018 in the San Francisco market and is now 98% occupied.
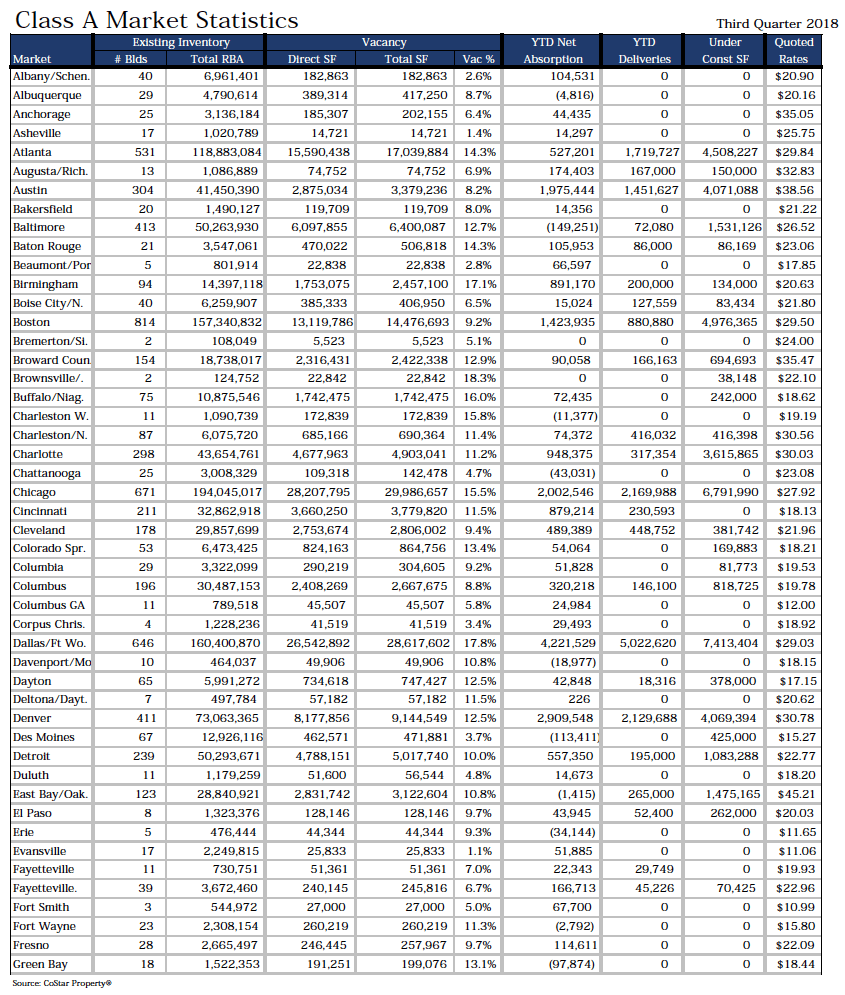
The largest projects underway at the end of third quar-ter 2018 were 433 W Van Buren St in the Chicago market, a 2,700,000-square-foot building with 7% of its space pre-leased, and 30 Hudson Yards, a 2,600,000-square-foot facility in the New York City market that is 98% pre-leased.
Inventory
Total office inventory in the U.S. market area amounted to 11,369,077,753 square feet in 569,311 buildings as of the end of the third quarter 2018. The Class-A office sector consisted of 3,608,137,462 square feet in 19,675 projects. There were 222,307 Class-B buildings totaling 5,287,434,788 square feet, and the Class-C sector consisted of 2,473,505,503 square feet in 327,329 buildings. Within the Office market there were 22,793 owner-occupied buildings accounting for 988,317,065 square feet of office space.
Sales Activity
 Tallying office building sales of 15,000 square feet or larger, U.S. office sales figures fell during the second quarter 2018 in terms of dollar volume compared to the first quarter of 2018.
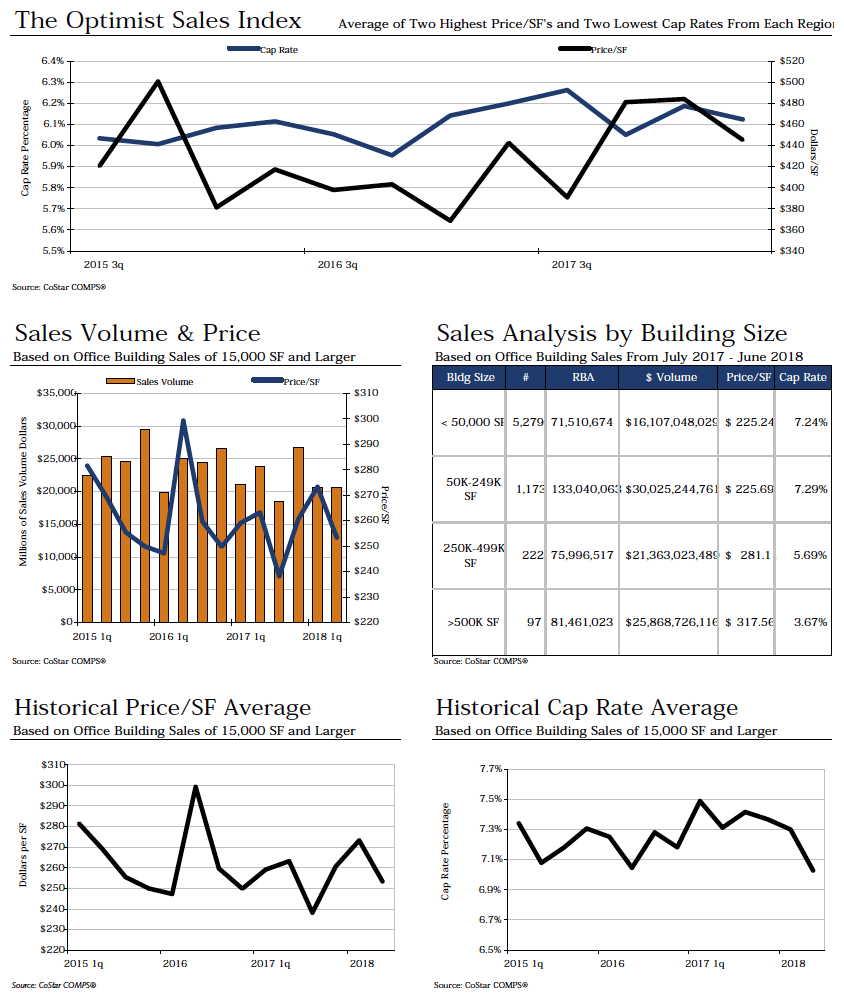
In the second quarter, 827 office transactions closed with a total volume of $20,673,113,456. The 827 buildings totaled 81,578,285 square feet and the average price per square foot equated to $253.41 per square foot. That compares to 749 transactions totaling $20,678,457,447 in the first quarter 2018. The total square footage in the first quarter was 75,655,330 square feet for an average price per square foot of $273.32.
Total office building sales activity in 2018 was down compared to 2017. In the first six months of 2018, the market saw 1,576 office sales transactions with a total volume of $41,351,570,903. The price per square foot averaged $262.99. In the same first six months of 2017, the market posted 1,653 transactions with a total volume of $44,892,356,945. The price per square foot averaged $261.30.
Cap rates have been lower in 2018, averaging 7.16% compared to the same period in 2017 when they averaged 7.40%.
One of the largest transactions that has occurred within the last 4 quarters in the U.S. market is the sale of 666 Fifth Ave in New York. This 1,450,000 square foot office building sold for $1.286-billion, or $886.95 per square foot. The property sold on 8/3/2018, at a 4.90% cap rate.
A
Albany/Schenectady/Troy
The Albany/Schenectady/Troy office market ended the quarter with a vacancy rate of 4.0%. The vacancy rate was up over the previous quarter, with net absorption totaling negative (76,848) square feet. Vacant sublease space increased to 44,410 square feet. Rental rates ended the third quarter at $15.46, a decrease over the previous quarter. A total of two buildings with 26,500 square feet of space delivered to the market, with 82,261 square feet still under construction at the end of the quarter.
Albuquerque
With no new office space being delivered to the market, and positive 286,004 square feet of net absorption, Albuquerque’s vacancy rate went from 7.5% to 6.7% in the quarter. Rental rates went from $15.70 to $15.64 during that time. At the end of the quarter, there was 12,000 square feet underway for future delivery.
Anchorage
With no space currently under construction, Anchorage absorbed 15,044 square feet of space and delivered 6,000 square feet of space, resulting in a vacancy rate that went from 5.8% to 5.7% over the course of the quarter. Rental rates went from $27.12 to $27.04 per square foot.
Asheville
The Asheville office market saw vacancies fall and rental rates increase from the second quarter 2018 to the third quarter 2018. The overall vacancy rate currently sits at 2.1%, from 2.4% in the previous quarter. Rental rates ended the quarter at $15.35 per square foot, from $15.00 in the previous quarter. There was a total of 9,000 square feet that delivered in the quarter, with 40,200 square feet still under construction at the end of the quarter.
Atlanta
The vacancy rate remained unchanged in Atlanta in the third quarter. With 154,384 square feet in deliveries, and positive 119,725 square feet in net absorption, the vacancy rate held at 11.6%, the same rate reported in the previous quarter. The market had 4,900,825 square feet under construction at the end of the quarter, and rental rates stood at $24.63 per square foot.
Augusta/Richmond County
The Augusta/Richmond County office market ended the quarter with a vacancy rate of 8.2%. The vacancy rate was down over the previous quarter, with net absorption totaling positive 174,026 square feet. Vacant sublease space increased to 20,243 square feet. Rental rates ended the third quarter at $16.97, an increase over the previous quarter. A total of two buildings with 169,640 square feet of space delivered to the market, with 172,194 square feet still under construction at the end of the quarter.
Austin
The Austin office market ended the quarter with a vacancy rate of 8.2%. The vacancy rate was down over the previous quarter, with net absorption totaling positive 1,059,906 square feet. Vacant sublease space increased to 758,791 square feet. Rental rates ended the third quarter at $34.00, an increase over the previous quarter. A total of six buildings with 138,264 square feet of space delivered to the market, with 4,789,265 square feet still under construction at the end of the quarter.
B
Bakersfield
With no new office space being delivered to the market, and positive 32,988 square feet of net absorption, Bakersfield’s vacancy rate went from 6.3% to 6.1% in the quarter. Rental rates went from $18.52 to $18.62 during that time. At the end of the quarter, there was 43,207 square feet underway for future delivery.
Baltimore
The Baltimore office market ended the quarter with a vacancy rate of 9.8%. The vacancy rate was up over the previous quarter, with net absorption totaling negative (248,197) square feet. Vacant sublease space decreased to 481,138 square feet. Rental rates ended the third quarter at $22.93, an increase over the previous quarter. A total of four buildings with 115,607 square feet of space delivered to the market, with 1,621,126 square feet still under construction at the end of the quarter.
Baton Rouge
The Baton Rouge office market saw vacancies fall and rental rates increase from the second quarter 2018 to the third quarter 2018. The overall vacancy rate currently sits at 7.4%, from 8.0% in the previous quarter. Rental rates ended the quarter at $17.99 per square foot, from $17.90 in the previous quarter. There was a total of 23,947 square feet that delivered in the quarter, with 140,539 square feet still under construction at the end of the quarter.
Beaumont/Port Arthur
With no space currently under construction, Beaumont/Port Arthur absorbed (11,462) square feet of space and delivered 3,000 square feet of space, resulting in a vacancy rate that went from 8.4% to 8.6% over the course of the quarter. Rental rates went from $12.67 to $12.70 per square foot.
Birmingham
The Birmingham office market ended the quarter with a vacancy rate of 9.6%. The vacancy rate was down over the previous quarter, with net absorption totaling positive 186,421 square feet. Vacant sublease space increased to 862,373 square feet. Rental rates ended the third quarter at $18.13, an increase over the previous quarter. A total of one building with 50,000 square feet of space delivered to the market, with 251,600 square feet still under construction at the end of the quarter.
Boise City/Nampa
The Boise City/Nampa office market saw vacancies fall and rental rates increase from the second quarter 2018 to the third quarter 2018. The overall vacancy rate currently sits at 6.4%, from 6.9% in the previous quarter. Rental rates ended the quarter at $17.25 per square foot, from $16.61 in the previous quarter. There was a total of 41,571 square feet that delivered in the quarter, with 267,125 square feet still under construction at the end of the quarter.
Boston
The Boston office market ended the quarter with a vacancy rate of 7.6%. The vacancy rate was down over the previous quarter, with net absorption totaling positive 1,383,159 square feet. Vacant sublease space increased to 2,159,843 square feet. Rental rates ended the third quarter at $23.17, a decrease over the previous quarter. A total of eight buildings with 782,748 square feet of space delivered to the market, with 5,376,985 square feet still under construction at the end of the quarter.
Bremerton/Silverdale
The Bremerton/Silverdale office market reported no new deliveries and no space under construction at the end of the third quarter 2018. With this limited construction activity, net absorption of positive 18,497 square feet caused the vacancy rate decreased from 7.5% to 7.2% in the quarter. Rental rates stood at $16.24.
Broward County
The Broward County office market ended the quarter with a vacancy rate of 8.5%. The vacancy rate was up over the previous quarter, with net absorption totaling positive 2,326 square feet. Vacant sublease space increased to 233,292 square feet. Rental rates ended the third quarter at $28.86, an increase over the previous quarter. A total of four buildings with 203,279 square feet of space delivered to the market, with 860,381 square feet still under construction at the end of the quarter.
Brownsville/Harlingen
The Brownsville/Harlingen office market saw vacancies rise and rental rates increase from the second quarter 2018 to the third quarter 2018. The overall vacancy rate currently sits at 6.5%, from 5.5% in the previous quarter. Rental rates ended the quarter at $16.15 per square foot, from $16.08 in the previous quarter. There was a total of 4,572 square feet that delivered in the quarter, with 82,901 square feet still under construction at the end of the quarter.
Buffalo/Niagara Falls
With no new office space being delivered to the market, and negative (14,412) square feet of net absorption, Buffalo/Niagara Fall’s vacancy rate went from 7.8% to 7.9% in the quarter. Rental rates went from $15.81 to $15.88 during that time. At the end of the quarter, there was 319,000 square feet underway for future delivery.
C
Charleston WV
The Charleston WV office market reported no new deliveries and no space under construction at the end of the third quarter 2018. With this limited construction activity, net absorption of positive 27,034 square feet caused the vacancy rate decreased from 6.0% to 5.9% in the quarter. Rental rates stood at $14.87.
Charleston/N Charleston
The Charleston/N Charleston office market saw vacancies rise and rental rates increase from the second quarter 2018 to the third quarter 2018. The overall vacancy rate currently sits at 5.7%, from 4.9% in the previous quarter. Rental rates ended the quarter at $25.10 per square foot, from $23.05 in the previous quarter. There was a total of 37,400 square feet that delivered in the quarter, with 798,095 square feet still under construction at the end of the quarter.
Charlotte
The Charlotte office market ended the quarter with a vacancy rate of 7.7%. The vacancy rate was down over the previous quarter, with net absorption totaling positive 1,780,906 square feet. Vacant sublease space decreased to 461,765 square feet. Rental rates ended the third quarter at $25.53, an increase over the previous quarter. A total of eight buildings with 1,249,961 square feet of space delivered to the market, with 3,870,759 square feet still under construction at the end of the quarter.
Chattanooga
The Chattanooga office market saw vacancies rise and rental rates increase from the second quarter 2018 to the third quarter 2018. The overall vacancy rate currently sits at 5.4%, from 4.7% in the previous quarter. Rental rates ended the quarter at $17.19 per square foot, from $16.62 in the previous quarter. There was a total of 33,000 square feet that delivered in the quarter, with 30,000 square feet still under construction at the end of the quarter.
Chicago
The vacancy rate remained unchanged in Chicago in the third quarter. With 396,930 square feet in deliveries, and positive 160,596 square feet in net absorption, the vacancy rate held at 12.1%, the same rate reported in the previous quarter. The market had 7,313,584 square feet under construction at the end of the quarter, and rental rates stood at $24.53 per square foot.
Cincinnati
The Cincinnati office market ended the quarter with a vacancy rate of 7.8%. The vacancy rate was down over the previous quarter, with net absorption totaling positive 549,124 square feet. Vacant sublease space decreased to 195,052 square feet. Rental rates ended the third quarter at $16.13, an increase over the previous quarter. A total of one building with 67,000 square feet of space delivered to the market, with 35,200 square feet still under construction at the end of the quarter.
Cleveland
The Cleveland office market ended the quarter with a vacancy rate of 8.4%. The vacancy rate was up over the previous quarter, with net absorption totaling positive 27,761 square feet. Vacant sublease space decreased to 254,985 square feet. Rental rates ended the third quarter at $17.30, a decrease over the previous quarter. A total of five buildings with 120,847 square feet of space delivered to the market, with 467,819 square feet still under construction at the end of the quarter.
Colorado Springs
With no new office space being delivered to the market, and positive 210,779 square feet of net absorption, Colorado Springs’s vacancy rate went from 10.6% to 9.9% in the quarter. Rental rates went from $15.43 to $15.64 during that time. At the end of the quarter, there was 202,045 square feet underway for future delivery.
Columbia
With no new office space being delivered to the market, and positive 28,731 square feet of net absorption, Columbia’s vacancy rate went from 7.1% to 7.0% in the quarter. Rental rates went from $14.95 to $15.15 during that time. At the end of the quarter, there was 89,768 square feet underway for future delivery.
Columbus
The Columbus office market ended the quarter with a vacancy rate of 7.1%. The vacancy rate was up over the previous quarter, with net absorption totaling negative (586,353) square feet. Vacant sublease space increased to 453,735 square feet. Rental rates ended the third quarter at $18.45, a decrease over the previous quarter. A total of four buildings with 162,600 square feet of space delivered to the market, with 1,037,339 square feet still under construction at the end of the quarter.
Columbus GA
The Columbus GA office market reported no new deliveries and no space under construction at the end of the third quarter 2018. With this limited construction activity, net absorption of positive 6,372 square feet caused the vacancy rate to unchanged from 6.4% to 6.4% in the quarter. Rental rates stood at $12.39.
Corpus Christi
The Corpus Christi office market saw vacancies fall and rental rates increase from the second quarter 2018 to the third quarter 2018. The overall vacancy rate currently sits at 7.6%, from 7.7% in the previous quarter. Rental rates ended the quarter at $14.54 per square foot, from $14.32 in the previous quarter. There was a total of 3,167 square feet that delivered in the quarter, with 50,000 square feet still under construction at the end of the quarter.
Dallas/Ft Worth
The Dallas/Ft Worth office market ended the quarter with a vacancy rate of 14.9%. The vacancy rate was down over the previous quarter, with net absorption totaling positive 1,667,502 square feet. Vacant sublease space decreased to 3,605,543 square feet. Rental rates ended the third quarter at $25.51, an increase over the previous quarter. A total of 32 buildings with 1,234,476 square feet of space delivered to the market, with 8,744,430 square feet still under construction at the end of the quarter.
D
Davenport/Moline/Rock Island
The Davenport/Moline/Rock Island office market reported no new deliveries and no space under construction at the end of the third quarter 2018. With this limited construction activity, net absorption of negative (62,160) square feet caused the vacancy rate increased from 5.4% to 6.0% in the quarter. Rental rates stood at $11.40.
Dayton
With no new office space being delivered to the market, and positive 271,305 square feet of net absorption, Dayton’s vacancy rate went from 8.6% to 7.9% in the quarter. Rental rates went from $14.40 to $14.59 during that time. At the end of the quarter, there was 384,640 square feet underway for future delivery.
Deltona/Daytona Beach
The Deltona/Daytona Beach office market saw vacancies rise and rental rates decrease from the second quarter 2018 to the third quarter 2018. The overall vacancy rate currently sits at 4.1%, from 4.0% in the previous quarter. Rental rates ended the quarter at $13.28 per square foot, from $13.75 in the previous quarter. There was a total of 155,000 square feet that delivered in the quarter, with 28,800 square feet still under construction at the end of the quarter.
Denver
The Denver office market ended the quarter with a vacancy rate of 9.9%. The vacancy rate was down over the previous quarter, with net absorption totaling positive 1,148,010 square feet. Vacant sublease space increased to 1,639,282 square feet. Rental rates ended the third quarter at $26.85, an increase over the previous quarter. A total of three buildings with 93,388 square feet of space delivered to the market, with 4,587,710 square feet still under construction at the end of the quarter.
Des Moines
With no new office space being delivered to the market, and positive 6,066 square feet of net absorption, Des Moines’s vacancy rate went from 4.0% to 3.9% in the quarter. Rental rates went from $14.04 to $14.01 during that time. At the end of the quarter, there was 601,011 square feet underway for future delivery.
Detroit
The vacancy rate remained unchanged in Detroit in the third quarter. With 386,944 square feet in deliveries, and positive 324,982 square feet in net absorption, the vacancy rate held at 9.1%, the same rate reported in the previous quarter. The market had 1,451,341 square feet under construction at the end of the quarter, and rental rates stood at $19.37 per square foot.
Duluth
With no new office space being delivered to the market, and positive 60,202 square feet of net absorption, Duluth’s vacancy rate went from 4.1% to 3.3% in the quarter. Rental rates went from $13.50 to $15.53 during that time. At the end of the quarter, there was 166,627 square feet underway for future delivery.
E
East Bay/Oakland
The East Bay/Oakland office market ended the quarter with a vacancy rate of 8.8%. The vacancy rate was up over the previous quarter, with net absorption totaling positive 31,435 square feet. Vacant sublease space increased to 548,220 square feet. Rental rates ended the third quarter at $37.46, a decrease over the previous quarter. A total of one building with 265,000 square feet of space delivered to the market, with 1,812,459 square feet still under construction at the end of the quarter.
El Paso
With no new office space being delivered to the market, and positive 35,750 square feet of net absorption, El Paso’s vacancy rate went from 6.4% to 6.4% in the quarter. Rental rates went from $14.85 to $15.70 during that time. At the end of the quarter, there was 294,001 square feet underway for future delivery.
Erie
With no new office space being delivered to the market, and negative (77,873) square feet of net absorption, Erie’s vacancy rate went from 3.1% to 4.0% in the quarter. Rental rates went from $10.15 to $10.41 during that time. At the end of the quarter, there was 346,000 square feet underway for future delivery.
Evansville
With no new office space being delivered to the market, and positive 48,398 square feet of net absorption, Evansville’s vacancy rate went from 4.0% to 3.6% in the quarter. Rental rates went from $11.38 to $11.34 during that time. At the end of the quarter, there was 10,000 square feet underway for future delivery.
F
Fayetteville
With no new office space being delivered to the market, and negative (18,509) square feet of net absorption, Fayetteville’s vacancy rate went from 7.9% to 8.2% in the quarter. Rental rates went from $15.87 to $15.18 during that time. At the end of the quarter, there was 32,910 square feet underway for future delivery.
Fayetteville/Springdale/Rogers
The vacancy rate remained unchanged in Fayetteville/Springdale/Rogers in the third quarter. With 52,246 square feet in deliveries, and positive 43,663 square feet in net absorption, the vacancy rate held at 6.0%, the same rate reported in the previous quarter. The market had 207,669 square feet under construction at the end of the quarter, and rental rates stood at $18.20 per square foot.
Fort Smith
The Fort Smith office market reported no new deliveries and no space under construction at the end of the third quarter 2018. With this limited construction activity, net absorption of negative (15,617) square feet caused the vacancy rate increased from 3.7% to 4.0% in the quarter. Rental rates stood at $10.81.
Fort Wayne
With no space currently under construction, Fort Wayne absorbed 5,775 square feet of space and delivered 35,310 square feet of space, resulting in a vacancy rate that went from 6.4% to 6.6% over the course of the quarter. Rental rates went from $14.10 to $13.79 per square foot.
Fresno
The Fresno office market saw vacancies fall and rental rates decrease from the second quarter 2018 to the third quarter 2018. The overall vacancy rate currently sits at 7.2%, from 7.5% in the previous quarter. Rental rates ended the quarter at $17.02 per square foot, from $17.09 in the previous quarter. There was a total of 14,049 square feet that delivered in the quarter, with 119,469 square feet still under construction at the end of the quarter.
G
Green Bay
With no new office space being delivered to the market, and negative (121,770) square feet of net absorption, Green Bay’s vacancy rate went from 6.5% to 7.2% in the quarter. Rental rates went from $12.29 to $12.88 during that time. At the end of the quarter, there was 15,000 square feet underway for future delivery.
Greensboro/Winston-Salem
With no new office space being delivered to the market, and positive 676,140 square feet of net absorption, Greensboro/Winston-Salem’s vacancy rate went from 8.2% to 7.0% in the quarter. Rental rates went from $15.02 to $15.21 during that time. At the end of the quarter, there was 220,974 square feet underway for future delivery.
Greenville/Spartanburg
The Greenville/Spartanburg office market ended the quarter with a vacancy rate of 7.8%. The vacancy rate was up over the previous quarter, with net absorption totaling negative (27,778) square feet. Vacant sublease space decreased to 120,417 square feet. Rental rates ended the third quarter at $17.57, a decrease over the previous quarter. A total of one building with 11,440 square feet of space delivered to the market, with 143,804 square feet still under construction at the end of the quarter.
H
Hampton Roads
With no new office space being delivered to the market, and negative (203,306) square feet of net absorption, Hampton Roads’s vacancy rate went from 8.1% to 8.5% in the quarter. Rental rates went from $17.70 to $17.86 during that time. At the end of the quarter, there was 669,150 square feet underway for future delivery.
Hartford With no new office space being delivered to the market, and positive 343,720 square feet of net absorption, Hartford’s vacancy rate went from 8.4% to 8.0% in the quarter. Rental rates went from $19.00 to $19.08 during that time. At the end of the quarter, there was 334,495 square feet underway for future delivery.
Hawaii
With no new office space being delivered to the market, and negative (93,475) square feet of net absorption, Hawaii’s vacancy rate went from 5.9% to 6.2% in the quarter. Rental rates went from $24.52 to $24.53 during that time. At the end of the quarter, there was 547,960 square feet underway for future delivery.
Houston
The Houston office market ended the quarter with a vacancy rate of 16.4%. The vacancy rate was down over the previous quarter, with net absorption totaling positive 1,138,149 square feet. Vacant sublease space decreased to 5,642,285 square feet. Rental rates ended the third quarter at $28.44, an increase over the previous quarter. A total of 10 buildings with 82,882 square feet of space delivered to the market, with 3,842,673 square feet still under construction at the end of the quarter.
Huntington/Ashland
The Huntington/Ashland office market reported no new deliveries and no space under construction at the end of the third quarter 2018. With this limited construction activity, net absorption of negative (141,770) square feet caused the vacancy rate increased from 2.1% to 3.7% in the quarter. Rental rates stood at $10.24.
Huntsville
With no new office space being delivered to the market, and negative (110,158) square feet of net absorption, Huntsville’s vacancy rate went from 6.6% to 7.1% in the quarter. Rental rates went from $13.71 to $14.45 during that time. At the end of the quarter, there was 399,000 square feet underway for future delivery.
I
Indianapolis
The Indianapolis office market ended the quarter with a vacancy rate of 7.2%. The vacancy rate was up over the previous quarter, with net absorption totaling negative (73,086) square feet. Vacant sublease space increased to 248,414 square feet. Rental rates ended the third quarter at $19.03, an increase over the previous quarter. A total of one building with 2,500 square feet of space delivered to the market, with 176,050 square feet still under construction at the end of the quarter.
Inland Empire (California)
The Inland Empire (California) office market saw vacancies fall and rental rates increase from the second quarter 2018 to the third quarter 2018. The overall vacancy rate currently sits at 7.2%, from 7.8% in the previous quarter. Rental rates ended the quarter at $20.99 per square foot, from $20.97 in the previous quarter. There was a total of 60,000 square feet that delivered in the quarter, with 719,750 square feet still under construction at the end of the quarter.
J
Jackson
The Jackson office market saw vacancies rise and rental rates increase from the second quarter 2018 to the third quarter 2018. The overall vacancy rate currently sits at 8.5%, from 7.5% in the previous quarter. Rental rates ended the quarter at $16.93 per square foot, from $16.53 in the previous quarter. There was a total of 9,984 square feet that delivered in the quarter, with 244,600 square feet still under construction at the end of the quarter.
Jacksonville (Florida)
The Jacksonville (Florida) office market ended the quarter with a vacancy rate of 8.0%. The vacancy rate was up over the previous quarter, with net absorption totaling negative (461,488) square feet. Vacant sublease space decreased to 374,599 square feet. Rental rates ended the third quarter at $19.68, an increase over the previous quarter. A total of seven buildings with 159,991 square feet of space delivered to the market, with 211,238 square feet still under construction at the end of the quarter.
K
Kansas City
The Kansas City office market ended the quarter with a vacancy rate of 6.8%. The vacancy rate was up over the previous quarter, with net absorption totaling positive 77,069 square feet. Vacant sublease space decreased to 433,313 square feet. Rental rates ended the third quarter at $19.62, an increase over the previous quarter. A total of two buildings with 228,291 square feet of space delivered to the market, with 1,308,813 square feet still under construction at the end of the quarter.
Killeen/Temple/Fort Hood
The Killeen/Temple/Fort Hood office market saw vacancies rise and rental rates decrease from the second quarter 2018 to the third quarter 2018. The overall vacancy rate currently sits at 6.3%, from 5.5% in the previous quarter. Rental rates ended the quarter at $12.79 per square foot, from $13.56 in the previous quarter. There was a total of 2,788 square feet that delivered in the quarter, with 50,000 square feet still under construction at the end of the quarter.
Kingsport/Bristol/Bristol
The Kingsport/Bristol/Bristol office market reported no new deliveries and no space under construction at the end of the third quarter 2018. With this limited construction activity, net absorption of negative (4,954) square feet caused the vacancy rate to unchanged from 5.5% to 5.5% in the quarter. Rental rates stood at $15.40.
Knoxville
With no new office space being delivered to the market, and negative (145,857) square feet of net absorption, Knoxville’s vacancy rate went from 4.9% to 5.3% in the quarter. Rental rates went from $15.24 to $15.27 during that time. At the end of the quarter, there was 110,850 square feet underway for future delivery.
L
Lafayette
With no new office space being delivered to the market, and positive 45,813 square feet of net absorption, Lafayette’s vacancy rate went from 6.4% to 5.9% in the quarter. Rental rates went from $15.24 to $14.90 during that time. At the end of the quarter, there was 20,000 square feet underway for future delivery.
Las Vegas
The Las Vegas office market ended the quarter with a vacancy rate of 12.3%. The vacancy rate was up over the previous quarter, with net absorption totaling negative (317,623) square feet. Vacant sublease space increased to 377,496 square feet. Rental rates ended the third quarter at $19.65, an increase over the previous quarter. A total of five buildings with 203,682 square feet of space delivered to the market, with 573,900 square feet still under construction at the end of the quarter.
Lexington/Fayette
With no new office space being delivered to the market, and negative (62,528) square feet of net absorption, Lexington/Fayette’s vacancy rate went from 7.1% to 7.4% in the quarter. Rental rates went from $17.17 to $17.14 during that time. At the end of the quarter, there was 216,906 square feet underway for future delivery.
Lincoln
The Lincoln office market saw vacancies fall and rental rates decrease from the second quarter 2018 to the third quarter 2018. The overall vacancy rate currently sits at 5.1%, from 5.2% in the previous quarter. Rental rates ended the quarter at $13.72 per square foot, from $13.98 in the previous quarter. There was a total of 47,000 square feet that delivered in the quarter, with 232,732 square feet still under construction at the end of the quarter.
Little Rock/N Little Rock
The Little Rock/N Little Rock office market saw vacancies fall and rental rates increase from the second quarter 2018 to the third quarter 2018. The overall vacancy rate currently sits at 3.7%, from 3.9% in the previous quarter. Rental rates ended the quarter at $17.19 per square foot, from $16.40 in the previous quarter. There was a total of 14,000 square feet that delivered in the quarter, with 3,500 square feet still under construction at the end of the quarter.
Long Island (New York)
The Long Island (New York) office market ended the quarter with a vacancy rate of 8.1%. The vacancy rate was up over the previous quarter, with net absorption totaling negative (737,985) square feet. Vacant sublease space increased to 1,015,144 square feet. Rental rates ended the third quarter at $27.99, an increase over the previous quarter. A total of six buildings with 372,500 square feet of space delivered to the market, with 7,338,960 square feet still under construction at the end of the quarter.
Los Angeles
The vacancy rate remained unchanged in Los Angeles in the third quarter. With 318,057 square feet in deliveries, and positive 362,361 square feet in net absorption, the vacancy rate held at 10.3%, the same rate reported in the previous quarter. The market had 5,809,910 square feet under construction at the end of the quarter, and rental rates stood at $36.12 per square foot.
Louisville
With no new office space being delivered to the market, and negative (376,964) square feet of net absorption, Louisville’s vacancy rate went from 5.7% to 6.4% in the quarter. Rental rates went from $16.82 to $17.30 during that time. At the end of the quarter, there was 328,797 square feet underway for future delivery.
Lubbock
With no new office space being delivered to the market, and negative (6,107) square feet of net absorption, Lubbock’s vacancy rate went from 5.9% to 6.0% in the quarter. Rental rates went from $14.10 to $14.22 during that time. At the end of the quarter, there was 9,384 square feet underway for future delivery.
M
Madison
The Madison office market saw vacancies rise and rental rates increase from the second quarter 2018 to the third quarter 2018. The overall vacancy rate currently sits at 6.2%, from 6.0% in the previous quarter. Rental rates ended the quarter at $16.41 per square foot, from $16.29 in the previous quarter. There was a total of 251,600 square feet that delivered in the quarter, with 235,293 square feet still under construction at the end of the quarter.
McAllen/Edinburg/Pharr
With no new office space being delivered to the market, and positive 8,071 square feet of net absorption, McAllen/Edinburg/Pharr’s vacancy rate went from 6.4% to 6.6% in the quarter. Rental rates went from $14.69 to $14.80 during that time. At the end of the quarter, there was 110,446 square feet underway for future delivery.
Memphis
With no new office space being delivered to the market, and positive 212,825 square feet of net absorption, Memphis’s vacancy rate went from 10.9% to 10.4% in the quarter. Rental rates went from $17.74 to $17.88 during that time. At the end of the quarter, there was 93,000 square feet underway for future delivery.
Miami-Dade County
The Miami-Dade County office market ended the quarter with a vacancy rate of 8.5%. The vacancy rate was up over the previous quarter, with net absorption totaling positive 66,782 square feet. Vacant sublease space increased to 418,865 square feet. Rental rates ended the third quarter at $35.97, an increase over the previous quarter. A total of five buildings with 410,502 square feet of space delivered to the market, with 2,229,245 square feet still under construction at the end of the quarter.
Milwaukee
With no new office space being delivered to the market, and positive 19,562 square feet of net absorption, Milwaukee’s vacancy rate went from 7.1% to 7.1% in the quarter. Rental rates went from $16.26 to $16.18 during that time. At the end of the quarter, there was 755,537 square feet underway for future delivery.
Minneapolis
The vacancy rate remained unchanged in Minneapolis in the third quarter. With 184,446 square feet in deliveries, and positive 95,652 square feet in net absorption, the vacancy rate held at 7.7%, the same rate reported in the previous quarter. The market had 1,274,381 square feet under construction at the end of the quarter, and rental rates stood at $21.61 per square foot.
Mobile
With no new office space being delivered to the market, and negative (30,677) square feet of net absorption, Mobile’s vacancy rate went from 6.7% to 6.7% in the quarter. Rental rates went from $14.13 to $14.05 during that time. At the end of the quarter, there was 46,200 square feet underway for future delivery.
Montgomery
The Montgomery office market reported no new deliveries and no space under construction at the end of the third quarter 2018. With this limited construction activity, net absorption of positive 12,583 square feet caused the vacancy rate decreased from 6.9% to 6.8% in the quarter. Rental rates stood at $14.66.
Myrtle Beach/Conway
With no new office space being delivered to the market, and positive 98,589 square feet of net absorption, Myrtle Beach/Conway’s vacancy rate went from 4.0% to 2.8% in the quarter. Rental rates went from $13.95 to $14.50 during that time. At the end of the quarter, there was 10,000 square feet underway for future delivery.
N
Nashville
The Nashville office market ended the quarter with a vacancy rate of 6.3%. The vacancy rate was down over the previous quarter, with net absorption totaling positive 250,880 square feet. Vacant sublease space decreased to 529,663 square feet. Rental rates ended the third quarter at $27.29, an increase over the previous quarter. A total of five buildings with 386,991 square feet of space delivered to the market, with 3,570,576 square feet still under construction at the end of the quarter.
New Orleans/Metairie/Kenner
The New Orleans/Metairie/Kenner office market ended the quarter with a vacancy rate of 7.4%. The vacancy rate was down over the previous quarter, with net absorption totaling positive 92,135 square feet. Vacant sublease space decreased to 50,227 square feet. Rental rates ended the third quarter at $17.81, an increase over the previous quarter. A total of one building with 12,200 square feet of space delivered to the market, with 19,791 square feet still under construction at the end of the quarter.
New York City
The New York City office market ended the quarter with a vacancy rate of 7.7%. The vacancy rate was down over the previous quarter, with net absorption totaling positive 1,725,067 square feet. Vacant sublease space increased to 4,753,377 square feet. Rental rates ended the third quarter at $61.52, an increase over the previous quarter. A total of two buildings with 286,854 square feet of space delivered to the market, with 14,166,645 square feet still under construction at the end of the quarter.
North Bay/Santa Rosa
The North Bay/Santa Rosa office market saw vacancies fall and rental rates decrease from the second quarter 2018 to the third quarter 2018. The overall vacancy rate currently sits at 8.4%, from 8.9% in the previous quarter. Rental rates ended the quarter at $26.47 per square foot, from $26.52 in the previous quarter. There was a total of 86,016 square feet that delivered in the quarter, with 17,091 square feet still under construction at the end of the quarter.
Northern New Jersey
The Northern New Jersey office market saw vacancies fall and rental rates increase from the second quarter 2018 to the third quarter 2018. The overall vacancy rate currently sits at 11.7%, from 12.1% in the previous quarter. Rental rates ended the quarter at $25.57 per square foot, from $25.52 in the previous quarter. There was a total of 62,640 square feet that delivered in the quarter, with 2,386,560 square feet still under construction at the end of the quarter.
O
Ocala
The Ocala office market reported no new deliveries and no space under construction at the end of the third quarter 2018. With this limited construction activity, net absorption of negative (5,486) square feet caused the vacancy rate increased from 6.7% to 6.8% in the quarter. Rental rates stood at $13.56.
Oklahoma City
The Oklahoma City office market ended the quarter with a vacancy rate of 7.0%. The vacancy rate was up over the previous quarter, with net absorption totaling negative (48,922) square feet. Vacant sublease space increased to 89,273 square feet. Rental rates ended the third quarter at $16.77, a decrease over the previous quarter. A total of five buildings with 30,221 square feet of space delivered to the market, with 311,969 square feet still under construction at the end of the quarter.
Olympia
With no space currently under construction, Olympia absorbed (45,966) square feet of space and delivered 3,200 square feet of space, resulting in a vacancy rate that went from 3.5% to 4.0% over the course of the quarter. Rental rates went from $16.84 to $17.16 per square foot.
Omaha/Council Bluffs
The Omaha/Council Bluffs office market ended the quarter with a vacancy rate of 6.4%. The vacancy rate was up over the previous quarter, with net absorption totaling positive 4,323 square feet. Vacant sublease space increased to 163,236 square feet. Rental rates ended the third quarter at $16.89, an increase over the previous quarter. A total of two buildings with 125,000 square feet of space delivered to the market, with 776,843 square feet still under construction at the end of the quarter.
Orange County (California)
The Orange County (California) office market saw vacancies rise and rental rates increase from the second quarter 2018 to the third quarter 2018. The overall vacancy rate currently sits at 10.1%, from 9.8% in the previous quarter. Rental rates ended the quarter at $31.36 per square foot, from $30.98 in the previous quarter. There was a total of 364,955 square feet that delivered in the quarter, with 803,086 square feet still under construction at the end of the quarter.
Orlando
The Orlando office market ended the quarter with a vacancy rate of 6.9%. The vacancy rate was down over the previous quarter, with net absorption totaling positive 172,728 square feet. Vacant sublease space increased to 194,694 square feet. Rental rates ended the third quarter at $20.77, a decrease over the previous quarter. A total of four buildings with 27,239 square feet of space delivered to the market, with 2,126,994 square feet still under construction at the end of the quarter.
P
Palm Beach County
The Palm Beach County office market ended the quarter with a vacancy rate of 10.1%. The vacancy rate was up over the previous quarter, with net absorption totaling positive 7,939 square feet. Vacant sublease space decreased to 184,477 square feet. Rental rates ended the third quarter at $29.56, a decrease over the previous quarter. A total of four buildings with 47,855 square feet of space delivered to the market, with 500,276 square feet still under construction at the end of the quarter.
Pensacola
The Pensacola office market saw vacancies rise and rental rates increase from the second quarter 2018 to the third quarter 2018. The overall vacancy rate currently sits at 4.7%, from 4.4% in the previous quarter. Rental rates ended the quarter at $15.69 per square foot, from $15.26 in the previous quarter. There was a total of 48,915 square feet that delivered in the quarter, with 200,000 square feet still under construction at the end of the quarter.
Peoria
The Peoria office market reported no new deliveries and no space under construction at the end of the third quarter 2018. With this limited construction activity, net absorption of negative (15,316) square feet caused the vacancy rate increased from 6.3% to 6.4% in the quarter. Rental rates stood at $12.42.
Philadelphia
The Philadelphia office market ended the quarter with a vacancy rate of 8.1%. The vacancy rate was up over the previous quarter, with net absorption totaling positive 443,032 square feet. Vacant sublease space increased to 1,442,613 square feet. Rental rates ended the third quarter at $22.87, an increase over the previous quarter. A total of four buildings with 1,419,221 square feet of space delivered to the market, with 3,036,593 square feet still under construction at the end of the quarter.
Phoenix
The Phoenix office market ended the quarter with a vacancy rate of 12.9%. The vacancy rate was down over the previous quarter, with net absorption totaling positive 874,469 square feet. Vacant sublease space decreased to 1,396,619 square feet. Rental rates ended the third quarter at $25.29, an increase over the previous quarter. A total of four buildings with 136,729 square feet of space delivered to the market, with 3,145,886 square feet still under construction at the end of the quarter.
Pittsburgh
The vacancy rate remained unchanged in Pittsburgh in the third quarter. With 48,287 square feet in deliveries, and positive 83,204 square feet in net absorption, the vacancy rate held at 8.4%, the same rate reported in the previous quarter. The market had 1,193,735 square feet under construction at the end of the quarter, and rental rates stood at $22.05 per square foot.
Port St Lucie/Fort Pierce
With no new office space being delivered to the market, and positive 18,885 square feet of net absorption, Port St Lucie/Fort Pierce’s vacancy rate went from 9.6% to 9.4% in the quarter. Rental rates went from $14.57 to $14.61 during that time. At the end of the quarter, there was 25,976 square feet underway for future delivery.
Portland
The Portland office market ended the quarter with a vacancy rate of 6.5%. The vacancy rate was down over the previous quarter, with net absorption totaling positive 609,933 square feet. Vacant sublease space decreased to 332,543 square feet. Rental rates ended the third quarter at $23.90, an increase over the previous quarter. A total of two buildings with 476,000 square feet of space delivered to the market, with 2,575,782 square feet still under construction at the end of the quarter.
Portland/South Portland
With no new office space being delivered to the market, and positive 8,857 square feet of net absorption, Portland/South Portland’s vacancy rate went from 3.5% to 3.5% in the quarter. Rental rates went from $14.28 to $15.51 during that time. At the end of the quarter, there was 163,894 square feet underway for future delivery.
Providence
The Providence office market ended the quarter with a vacancy rate of 5.4%. The vacancy rate was up over the previous quarter, with net absorption totaling positive 386,740 square feet. Vacant sublease space increased to 21,642 square feet. Rental rates ended the third quarter at $18.34, an increase over the previous quarter. A total of three buildings with 462,700 square feet of space delivered to the market, with 260,520 square feet still under construction at the end of the quarter.
R
Raleigh/Durham
The Raleigh/Durham office market ended the quarter with a vacancy rate of 6.9%. The vacancy rate was down over the previous quarter, with net absorption totaling positive 194,770 square feet. Vacant sublease space increased to 255,953 square feet. Rental rates ended the third quarter at $23.52, an increase over the previous quarter. A total of two buildings with 30,765 square feet of space delivered to the market, with 3,976,020 square feet still under construction at the end of the quarter.
Reno/Sparks
The Reno/Sparks office market saw vacancies fall and rental rates decrease from the second quarter 2018 to the third quarter 2018. The overall vacancy rate currently sits at 8.8%, from 9.0% in the previous quarter. Rental rates ended the quarter at $17.72 per square foot, from $17.86 in the previous quarter. There was a total of 20,000 square feet that delivered in the quarter, with 91,331 square feet still under construction at the end of the quarter.
Richmond VA
The vacancy rate remained unchanged in Richmond VA in the third quarter. With 46,461 square feet in deliveries, and positive 6,196 square feet in net absorption, the vacancy rate held at 6.5%, the same rate reported in the previous quarter. The market had 1,470,324 square feet under construction at the end of the quarter, and rental rates stood at $19.01 per square foot.
Roanoke
The Roanoke office market reported no new deliveries and no space under construction at the end of the third quarter 2018. With this limited construction activity, net absorption of positive 467 square feet caused the vacancy rate to unchanged from 7.2% to 7.2% in the quarter. Rental rates stood at $15.78.
Rochester
The Rochester office market ended the quarter with a vacancy rate of 7.7%. The vacancy rate was up over the previous quarter, with net absorption totaling negative (722,571) square feet. Vacant sublease space decreased to 101,248 square feet. Rental rates ended the third quarter at $13.37, an increase over the previous quarter. A total of one building with 59,850 square feet of space delivered to the market, with 45,000 square feet still under construction at the end of the quarter.
S
Sacramento
The Sacramento office market ended the quarter with a vacancy rate of 9.5%. The vacancy rate was down over the previous quarter, with net absorption totaling positive 147,382 square feet. Vacant sublease space increased to 233,320 square feet. Rental rates ended the third quarter at $22.45, an increase over the previous quarter. A total of one building with 11,242 square feet of space delivered to the market, with 594,218 square feet still under construction at the end of the quarter.
Salinas
With no new office space being delivered to the market, and positive 6,610 square feet of net absorption, Salinas’s vacancy rate went from 6.0% to 5.9% in the quarter. Rental rates went from $20.69 to $20.98 during that time. At the end of the quarter, there was 9,731 square feet underway for future delivery.
Salt Lake City
The Salt Lake City office market ended the quarter with a vacancy rate of 7.3%. The vacancy rate was down over the previous quarter, with net absorption totaling positive 918,385 square feet. Vacant sublease space decreased to 537,912 square feet. Rental rates ended the third quarter at $21.13, a decrease over the previous quarter. A total of six buildings with 515,766 square feet of space delivered to the market, with 3,785,640 square feet still under construction at the end of the quarter.
San Antonio
The vacancy rate remained unchanged in San Antonio in the third quarter. With 37,584 square feet in deliveries, and positive 12,522 square feet in net absorption, the vacancy rate held at 9.5%, the same rate reported in the previous quarter. The market had 1,807,942 square feet under construction at the end of the quarter, and rental rates stood at $21.62 per square foot.
San Diego
The San Diego office market ended the quarter with a vacancy rate of 9.7%. The vacancy rate was up over the previous quarter, with net absorption totaling negative (335,313) square feet. Vacant sublease space decreased to 502,582 square feet. Rental rates ended the third quarter at $32.51, an increase over the previous quarter. A total of three buildings with 185,240 square feet of space delivered to the market, with 888,005 square feet still under construction at the end of the quarter.
San Francisco
The San Francisco office market ended the quarter with a vacancy rate of 6.3%. The vacancy rate was up over the previous quarter, with net absorption totaling positive 629,068 square feet. Vacant sublease space increased to 1,700,298 square feet. Rental rates ended the third quarter at $61.15, an increase over the previous quarter. A total of six buildings with 850,543 square feet of space delivered to the market, with 7,527,204 square feet still under construction at the end of the quarter.
San Luis Obispo/Paso Robles
The San Luis Obispo/Paso Robles office market saw vacancies rise and rental rates decrease from the second quarter 2018 to the third quarter 2018. The overall vacancy rate currently sits at 2.3%, from 2.1% in the previous quarter. Rental rates ended the quarter at $21.68 per square foot, from $21.95 in the previous quarter. There was a total of 8,411 square feet that delivered in the quarter, with 74,449 square feet still under construction at the end of the quarter.
Santa Barbara/Sta Maria/Goleta With no new office space being delivered to the market, and positive 34,142 square feet of net absorption, Santa Barbara/Sta Maria/Goleta’s vacancy rate went from 3.8% to 3.5% in the quarter. Rental rates went from $23.27 to $23.68 during that time. At the end of the quarter, there was 90,000 square feet underway for future delivery.
Santa Cruz/Watsonville
The Santa Cruz/Watsonville office market saw vacancies fall and rental rates increase from the second quarter 2018 to the third quarter 2018. The overall vacancy rate currently sits at 4.9%, from 5.7% in the previous quarter. Rental rates ended the quarter at $21.80 per square foot, from $21.21 in the previous quarter. There was a total of 3,213 square feet that delivered in the quarter, with 3,124 square feet still under construction at the end of the quarter.
Savannah
With no new office space being delivered to the market, and positive 15,112 square feet of net absorption, Savannah’s vacancy rate went from 4.4% to 4.4% in the quarter. Rental rates went from $17.03 to $17.45 during that time. At the end of the quarter, there was 10,800 square feet underway for future delivery.
Seattle/Puget Sound
The Seattle/Puget Sound office market ended the quarter with a vacancy rate of 6.7%. The vacancy rate was down over the previous quarter, with net absorption totaling positive 668,728 square feet. Vacant sublease space decreased to 989,786 square feet. Rental rates ended the third quarter at $33.00, an increase over the previous quarter. A total of four buildings with 30,217 square feet of space delivered to the market, with 7,254,367 square feet still under construction at the end of the quarter.
Shreveport/Bossier City
The Shreveport/Bossier City office market reported no new deliveries and no space under construction at the end of the third quarter 2018. With this limited construction activity, net absorption of positive 17,713 square feet caused the vacancy rate decreased from 8.9% to 8.8% in the quarter. Rental rates stood at $14.35.
South Bay/San Jose
The South Bay/San Jose office market ended the quarter with a vacancy rate of 9.2%. The vacancy rate was down over the previous quarter, with net absorption totaling positive 737,562 square feet. Vacant sublease space decreased to 1,859,262 square feet. Rental rates ended the third quarter at $42.59, an increase over the previous quarter. A total of one building with 29,989 square feet of space delivered to the market, with 4,456,643 square feet still under construction at the end of the quarter.
South Bend/Mishawaka
With no new office space being delivered to the market, and positive 97,502 square feet of net absorption, South Bend/Mishawaka’s vacancy rate went from 7.6% to 6.9% in the quarter. Rental rates went from $14.52 to $13.35 during that time. At the end of the quarter, there was 8,400 square feet underway for future delivery.
Southwest Florida
With no new office space being delivered to the market, and positive 50,970 square feet of net absorption, Southwest Florida’s vacancy rate went from 7.0% to 6.8% in the quarter. Rental rates went from $15.03 to $14.78 during that time. At the end of the quarter, there was 218,018 square feet underway for future delivery.
Spokane
With no new office space being delivered to the market, and positive 81,027 square feet of net absorption, Spokane’s vacancy rate went from 10.4% to 10.0% in the quarter. Rental rates went from $15.76 to $16.19 during that time. At the end of the quarter, there was 11,710 square feet underway for future delivery.
Springfield
With no new office space being delivered to the market, and positive 22,231 square feet of net absorption, Springfield’s vacancy rate went from 4.7% to 4.6% in the quarter. Rental rates went from $12.39 to $12.54 during that time. At the end of the quarter, there was 8,000 square feet underway for future delivery.
St. Louis
The St. Louis office market ended the quarter with a vacancy rate of 7.9%. The vacancy rate was down over the previous quarter, with net absorption totaling positive 86,791 square feet. Vacant sublease space increased to 367,038 square feet. Rental rates ended the third quarter at $19.71, an increase over the previous quarter. A total of one building with 5,208 square feet of space delivered to the market, with 1,050,962 square feet still under construction at the end of the quarter.
Stockton/Modesto
With no new office space being delivered to the market, and positive 94,652 square feet of net absorption, Stockton/Modesto’s vacancy rate went from 5.8% to 5.3% in the quarter. Rental rates went from $16.01 to $16.27 during that time. At the end of the quarter, there was 23,051 square feet underway for future delivery.
Syracuse
The Syracuse office market saw vacancies fall and rental rates increase from the second quarter 2018 to the third quarter 2018. The overall vacancy rate currently sits at 6.7%, from 6.9% in the previous quarter. Rental rates ended the quarter at $14.08 per square foot, from $13.90 in the previous quarter. There was a total of 90,000 square feet that delivered in the quarter, with 25,000 square feet still under construction at the end of the quarter.
T
Tallahassee
The Tallahassee office market saw vacancies fall and rental rates increase from the second quarter 2018 to the third quarter 2018. The overall vacancy rate currently sits at 4.2%, from 4.5% in the previous quarter. Rental rates ended the quarter at $17.21 per square foot, from $16.39 in the previous quarter. There was a total of 21,800 square feet that delivered in the quarter, with 11,440 square feet still under construction at the end of the quarter.
Tampa/St Petersburg
The Tampa/St Petersburg office market ended the quarter with a vacancy rate of 6.8%. The vacancy rate was down over the previous quarter, with net absorption totaling positive 455,261 square feet. Vacant sublease space increased to 659,079 square feet. Rental rates ended the third quarter at $21.73, an increase over the previous quarter. A total of six buildings with 183,300 square feet of space delivered to the market, with 1,412,159 square feet still under construction at the end of the quarter.
Toledo
With no new office space being delivered to the market, and positive 40,107 square feet of net absorption, Toledo’s vacancy rate went from 4.9% to 4.8% in the quarter. Rental rates went from $13.26 to $13.38 during that time. At the end of the quarter, there was 120,020 square feet underway for future delivery.
Tucson
The vacancy rate remained unchanged in Tucson in the third quarter. With 50,500 square feet in deliveries, and positive 42,164 square feet in net absorption, the vacancy rate held at 8.4%, the same rate reported in the previous quarter. The market had 542,735 square feet under construction at the end of the quarter, and rental rates stood at $19.15 per square foot.
Tulsa
The Tulsa office market ended the quarter with a vacancy rate of 10.4%. The vacancy rate was up over the previous quarter, with net absorption totaling negative (54,579) square feet. Vacant sublease space decreased to 444,570 square feet. Rental rates ended the third quarter at $15.42, an increase over the previous quarter. A total of two buildings with 21,473 square feet of space delivered to the market, with 365,741 square feet still under construction at the end of the quarter.
U
Utica/Rome
The Utica/Rome office market reported no new deliveries and no space under construction at the end of the third quarter 2018. With this limited construction activity, net absorption of negative (86,403) square feet caused the vacancy rate increased from 2.0% to 2.9% in the quarter. Rental rates stood at $11.34.
V
Visalia/Porterville
With no new office space being delivered to the market, and positive 14,061 square feet of net absorption, Visalia/Porterville’s vacancy rate went from 3.1% to 2.9% in the quarter. Rental rates went from $16.48 to $16.02 during that time. At the end of the quarter, there was 11,600 square feet underway for future delivery.
W
Washington
The vacancy rate remained unchanged in Washington in the third quarter. With 1,494,500 square feet in deliveries, and positive 1,108,865 square feet in net absorption, the vacancy rate held at 13.1%, the same rate reported in the previous quarter. The market had 8,822,583 square feet under construction at the end of the quarter, and rental rates stood at $35.93 per square foot.
West Michigan
The West Michigan office market saw vacancies fall and rental rates increase from the second quarter 2018 to the third quarter 2018. The overall vacancy rate currently sits at 4.4%, from 4.6% in the previous quarter. Rental rates ended the quarter at $14.89 per square foot, from $14.39 in the previous quarter. There was a total of 26,486 square feet that delivered in the quarter, with 337,798 square feet still under construction at the end of the quarter.
Westchester/So Connecticut
The Westchester/So Connecticut office market saw vacancies fall and rental rates decrease from the second quarter 2018 to the third quarter 2018. The overall vacancy rate currently sits at 11.6%, from 11.8% in the previous quarter. Rental rates ended the quarter at $27.86 per square foot, from $28.51 in the previous quarter. There was a total of 24,108 square feet that delivered in the quarter, with 464,254 square feet still under construction at the end of the quarter.
Wichita
The vacancy rate remained unchanged in Wichita in the third quarter. With 8,000 square feet in deliveries, and positive 20,366 square feet in net absorption, the vacancy rate held at 7.9%, the same rate reported in the previous quarter. The market had 60,000 square feet under construction at the end of the quarter, and rental rates stood at $13.98 per square foot.
Wilmington
The vacancy rate remained unchanged in Wilmington in the third quarter. With 102,092 square feet in deliveries, and positive 95,119 square feet in net absorption, the vacancy rate held at 3.5%, the same rate reported in the previous quarter. The market had 188,535 square feet under construction at the end of the quarter, and rental rates stood at $17.64 per square foot.
Y
Yakima
With no new office space being delivered to the market, and positive 12,481 square feet of net absorption, Yakima’s vacancy rate went from 4.7% to 4.4% in the quarter. Rental rates went from $11.78 to $13.47 during that time. At the end of the quarter, there was 8,800 square feet underway for future delivery.
Youngstown/Warren/Boardman
With no new office space being delivered to the market, and positive 164,450 square feet of net absorption, Youngstown/Warren/Boardman’s vacancy rate went from 5.0% to 4.0% in the quarter. Rental rates went from $9.90 to $10.39 during that time. At the end of the quarter, there was 2,500 square feet underway for future delivery.
Inventory & Development Graphs
Figures at a Glance
Leasing Activity
Sales Activity
Terms & Definitions
Methodology