Below is the national summary of market trends for industrial sectors, per CoStar’s statistics. You can click within this article to reach your specific interests via title or alpha listings. Please contact us if you want any additional information on this report or any industrial locations or leasing availabilities.
The Industrial Market Overview
Table of Contents – Click for your interested cities/areas via this alpha list
A | B | C | D | E | F | G | H | I | J | K | L | M | N | O | P | Q | R | S | T | U | V | W | X | Y | Z
Inventory & Development Graphs
The Industrial Market Overview
Vacancy Stays at 4.6% | Net Absorption Positive 72,270,117 SF
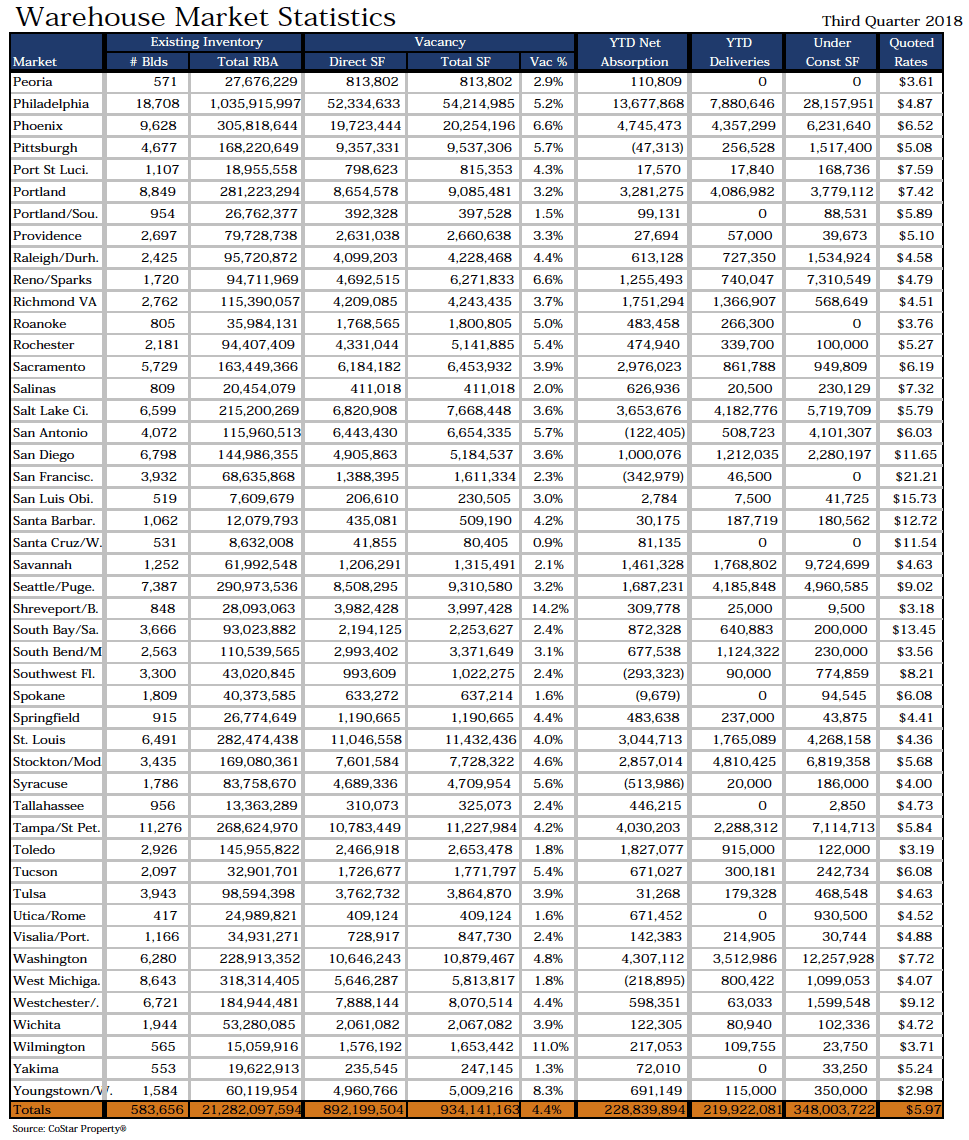
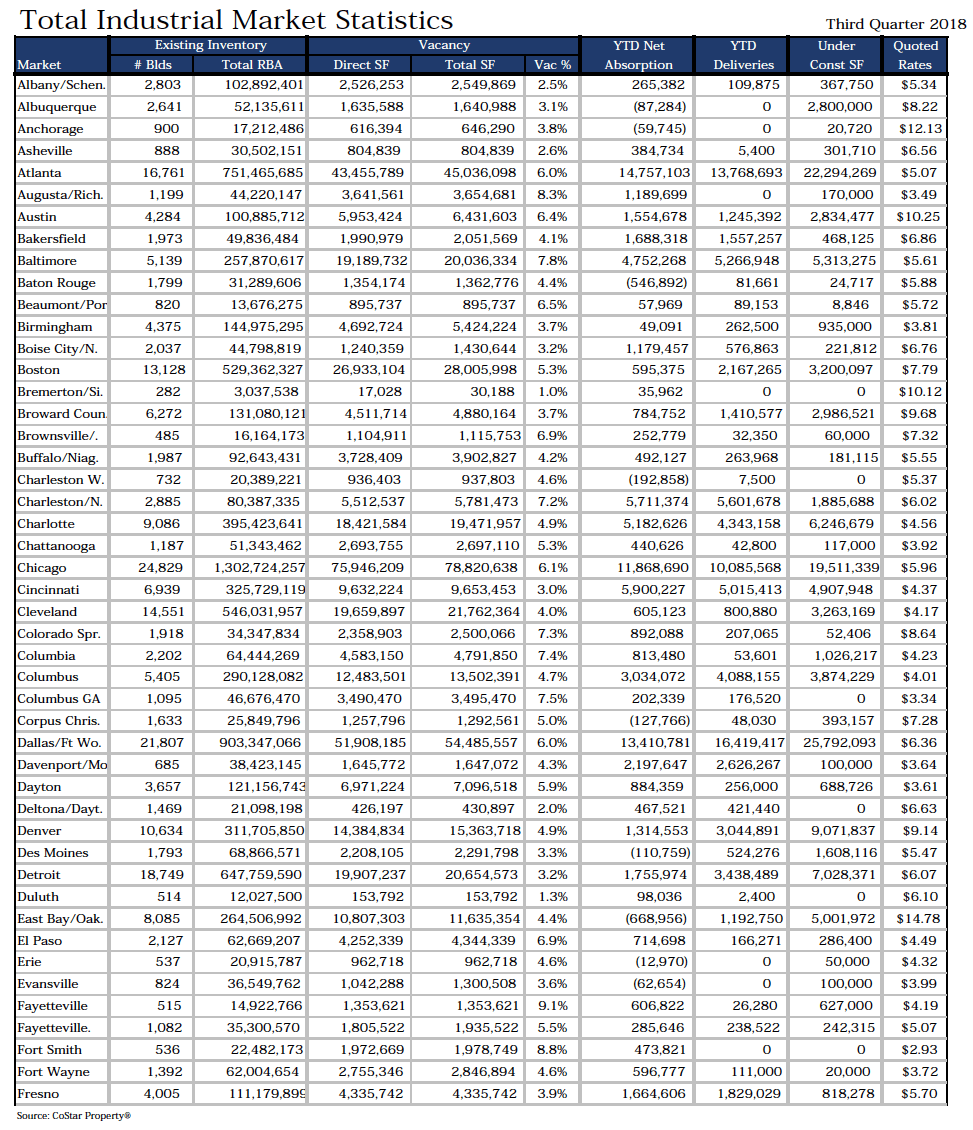
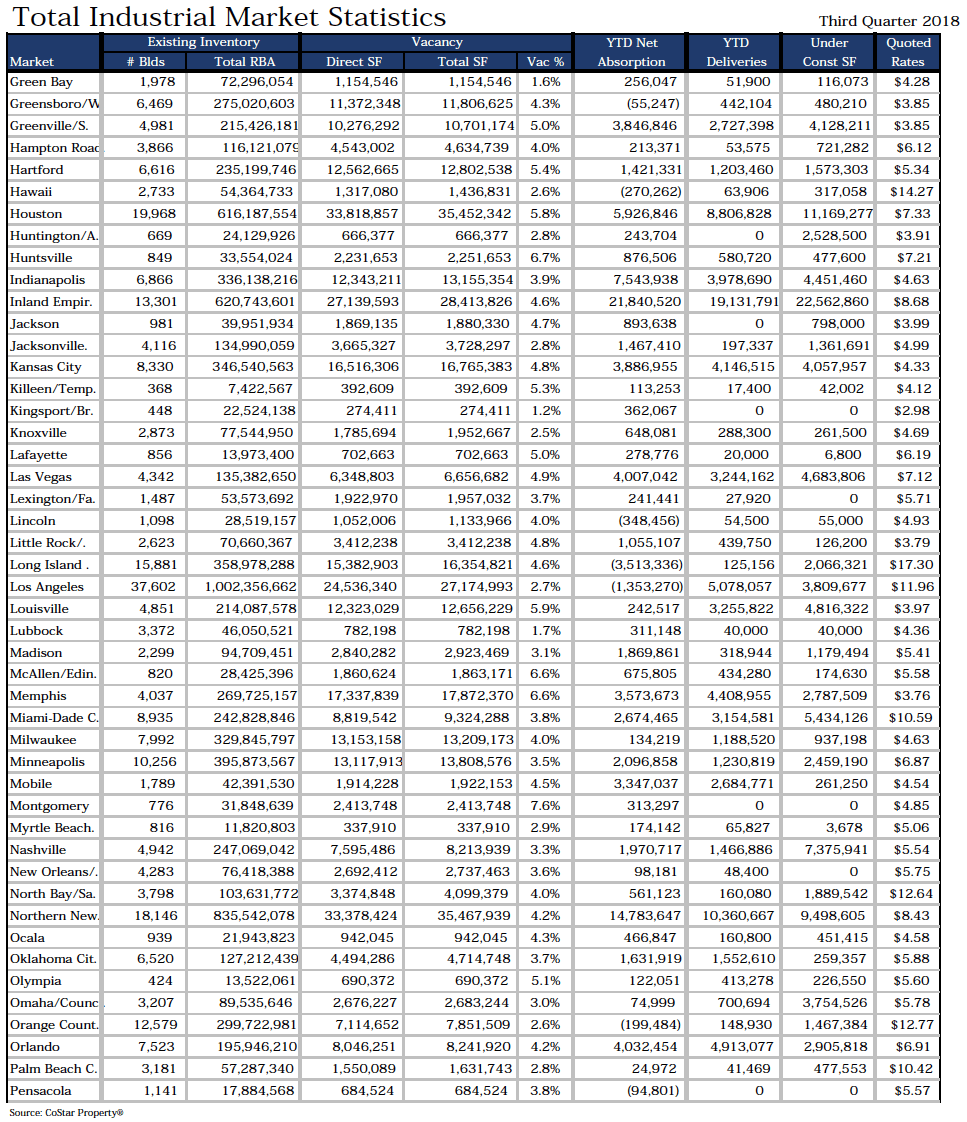
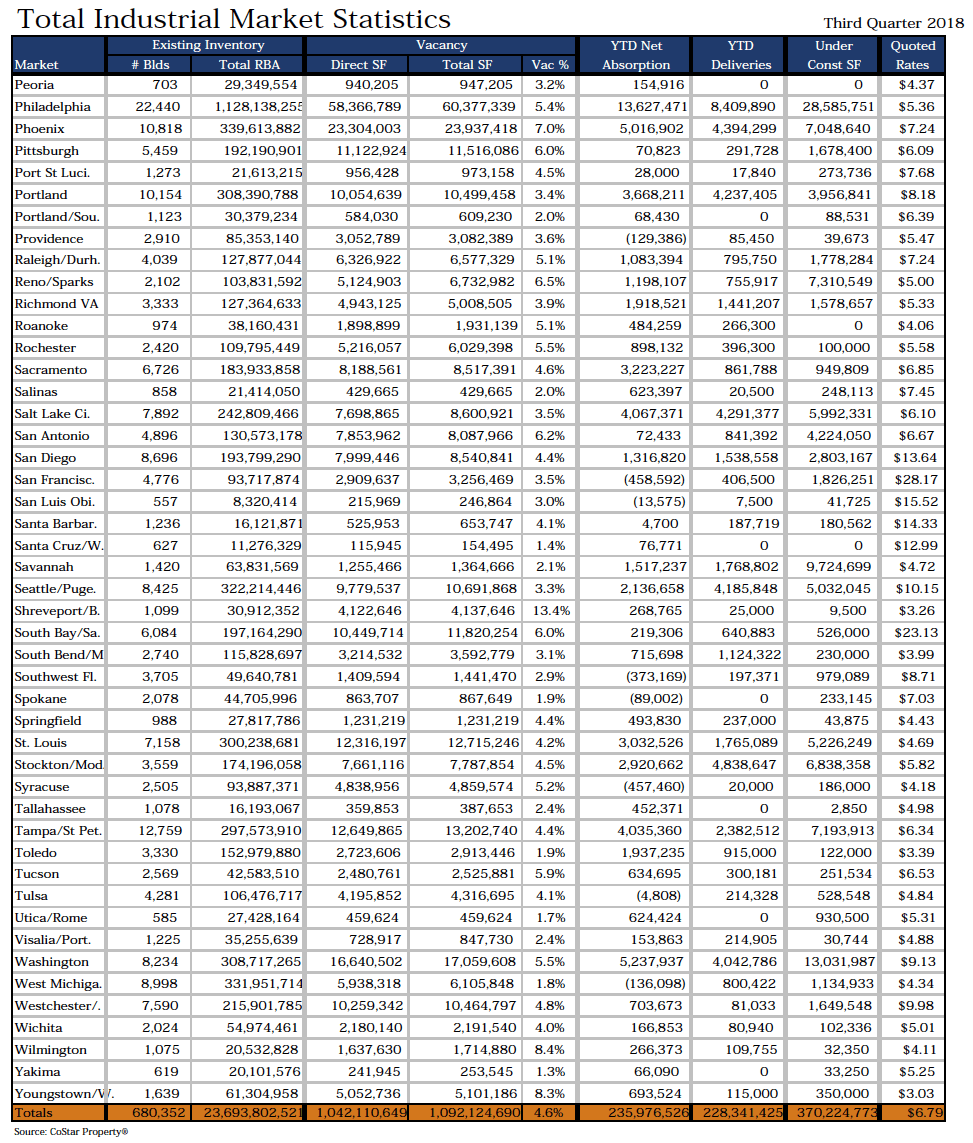
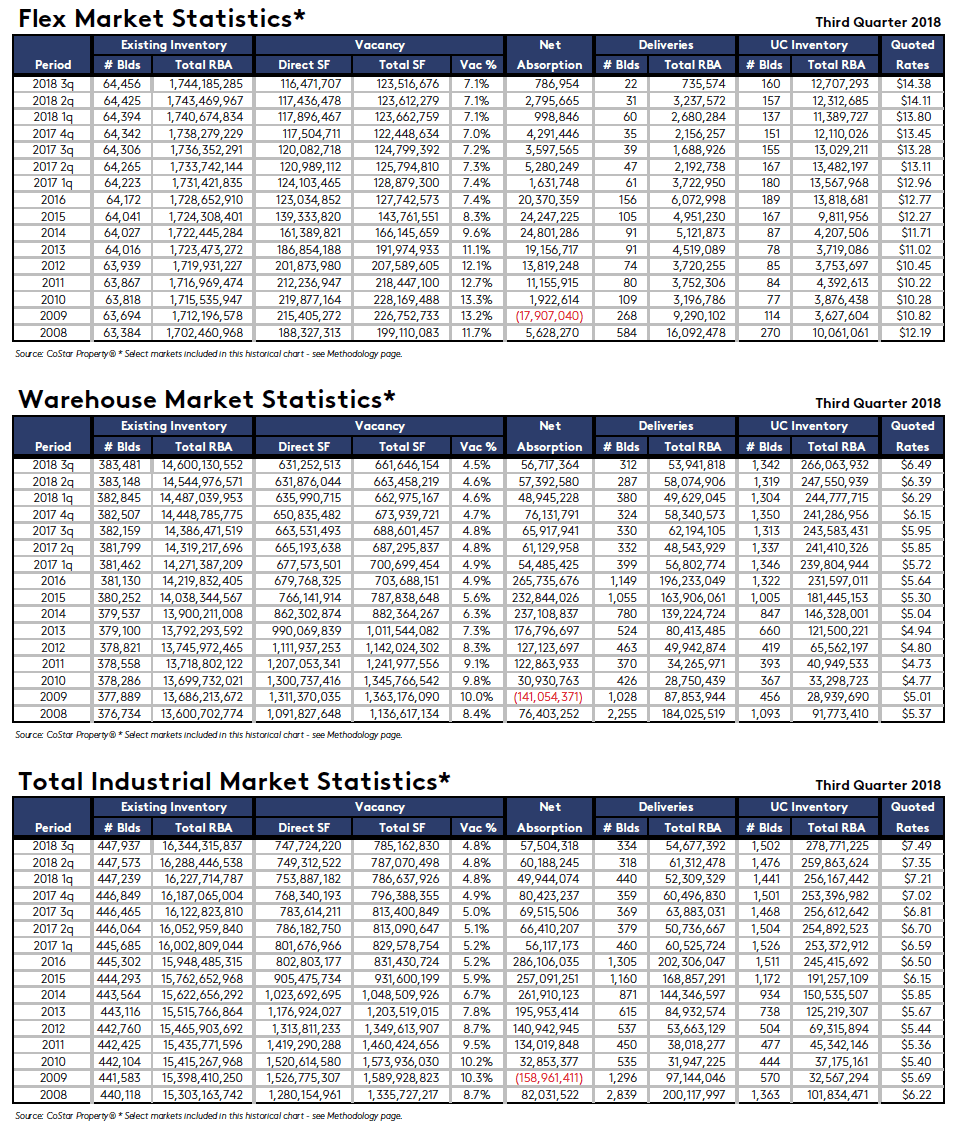
The U.S. Industrial market ended the third quarter 2018 with a vacancy rate of 4.6%. The vacancy rate was unchanged over the previous quarter, with net absorption totaling positive 72,270,117 square feet in the third quarter. Vacant sublease space increased in the quarter, ending the quarter at 50,014,041 square feet. Rental rates ended the third quarter at $6.79, an increase over the previous quarter. A total of 479 buildings delivered to the market in the quarter totaling 70,407,879 square feet, with 370,224,773 square feet still under construction at the end of the quarter.
Absorption
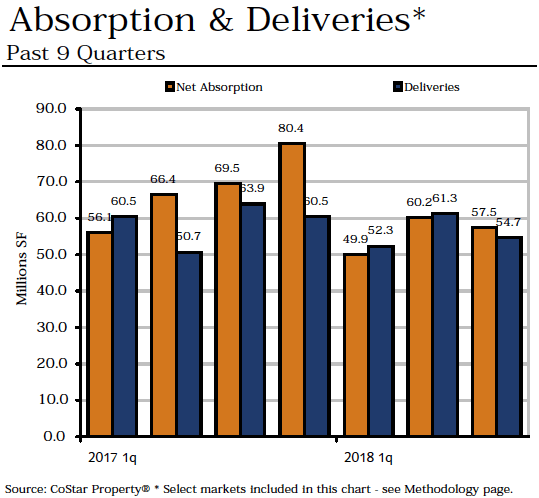
Net absorption for the overall U.S. industrial market was positive 72,270,117 square feet in the third quarter 2018. That compares to positive 89,338,604 square feet in the second quarter 2018, positive 74,367,805 square feet in the first quarter 2018, and positive 113,748,669 square feet in the fourth quarter 2017.
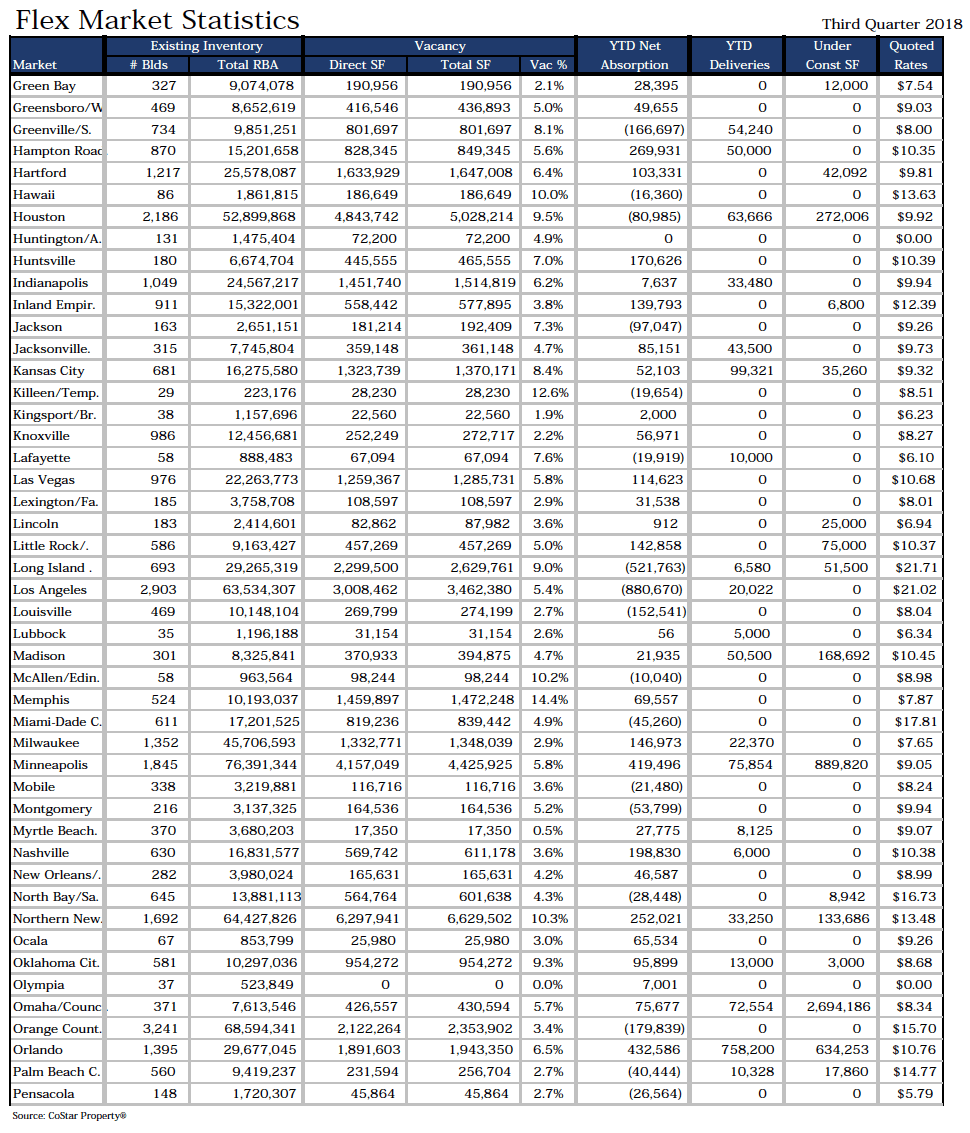
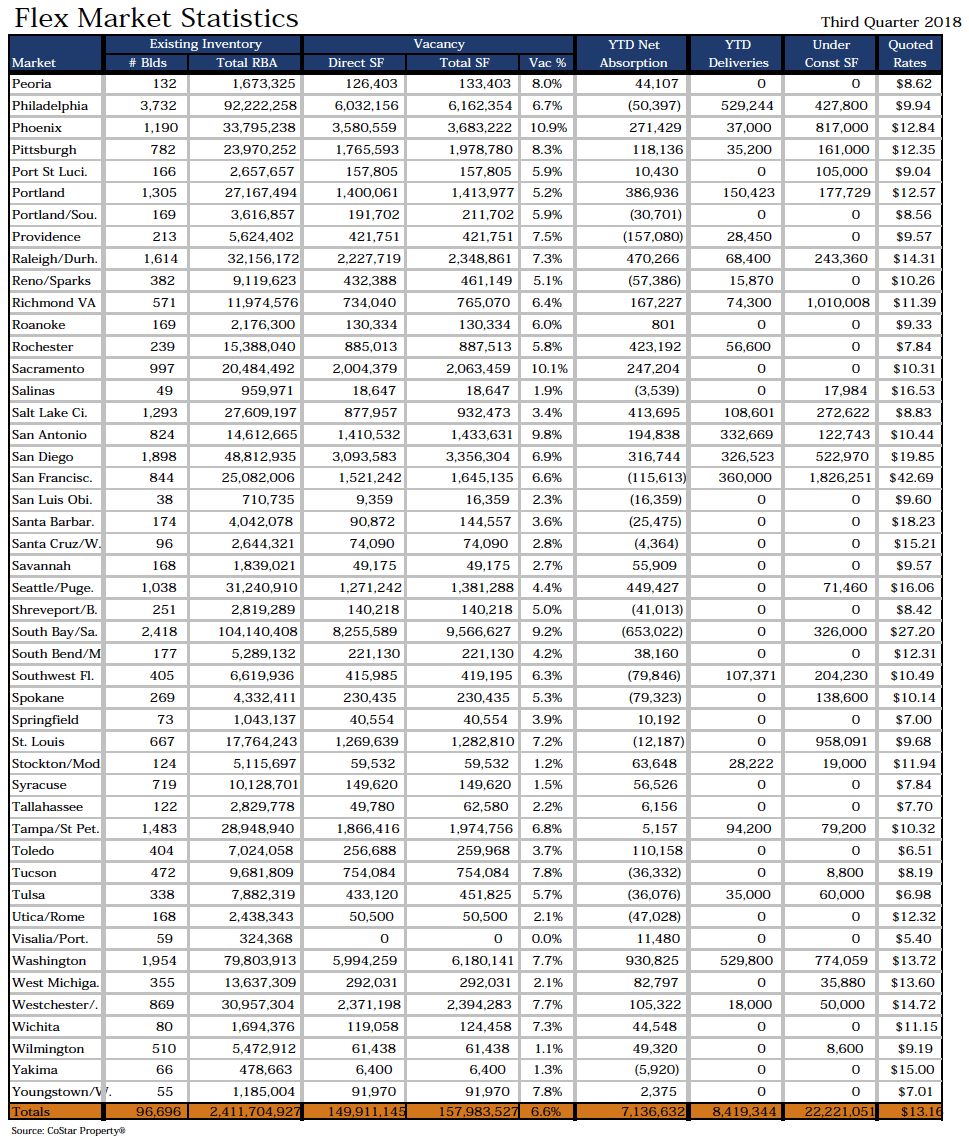
The Flex building market recorded net absorption of positive 2,159,628 square feet in the third quarter 2018, compared to positive 2,635,865 square feet in the second quarter 2018, positive 2,341,139 in the first quarter 2018, and positive 6,702,600 in the fourth quarter 2017.
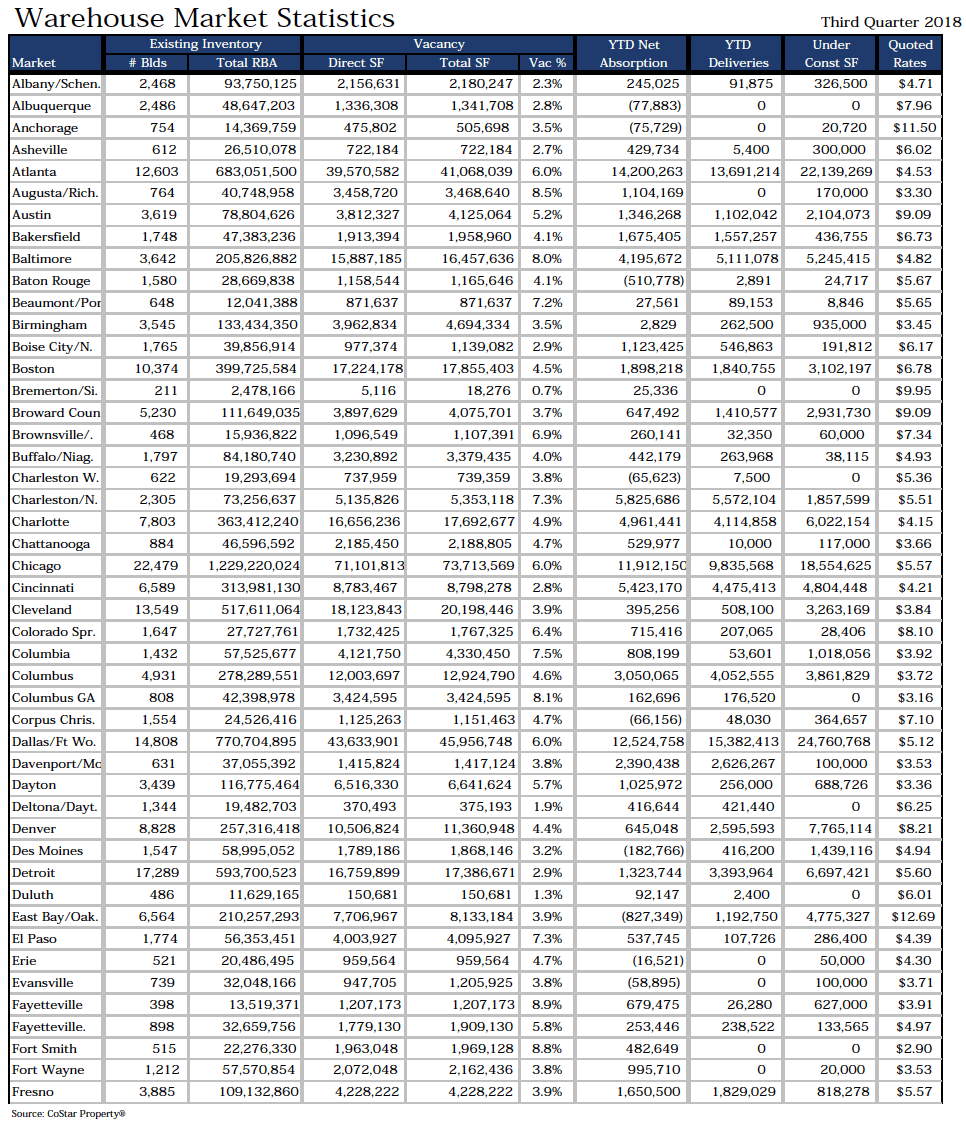
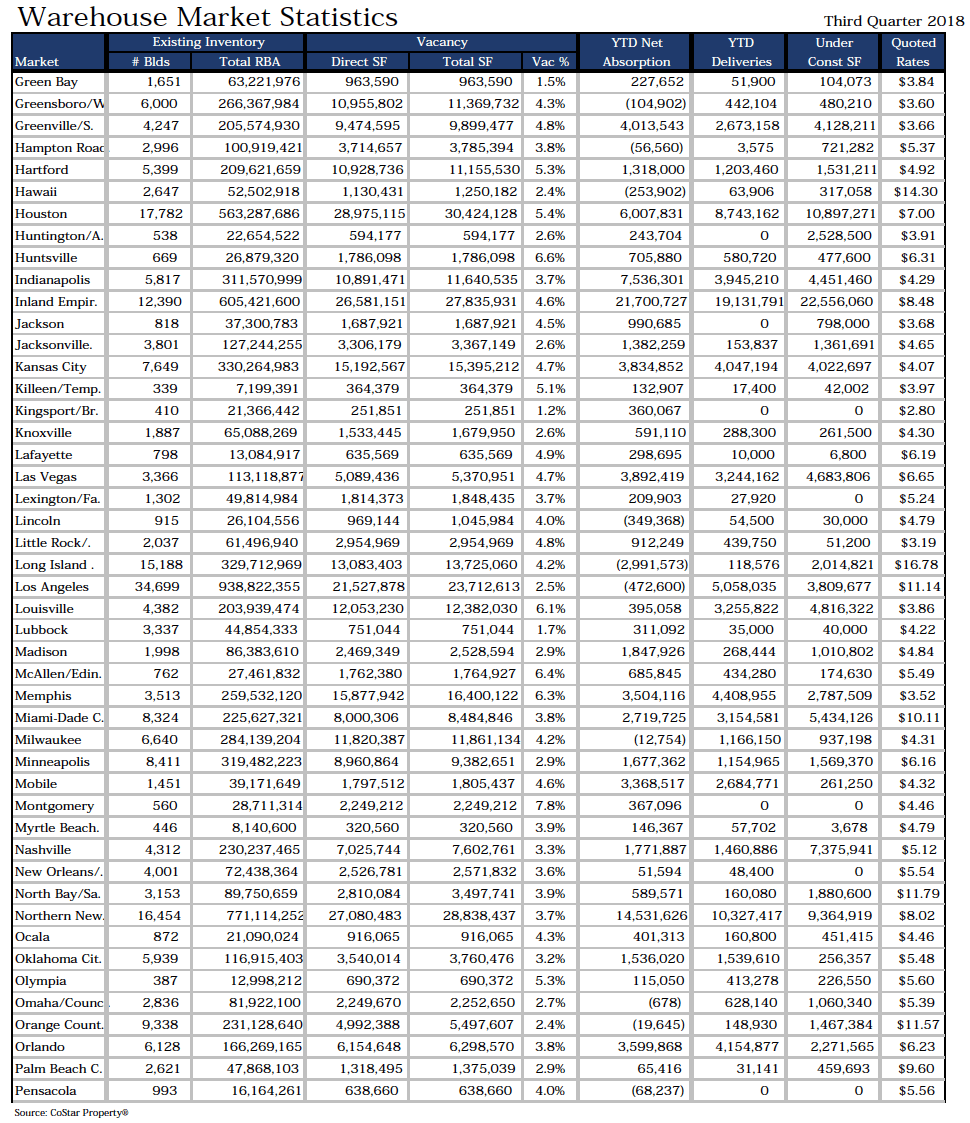
The warehouse building market recorded net absorption of positive 70,110,489 square feet in the third quarter 2018 compared to positive 86,702,739 square feet in the second quarter 2018, positive 72,026,666 in the first quarter 2018, and positive 107,046,069 in the fourth quarter 2017.
Vacancy
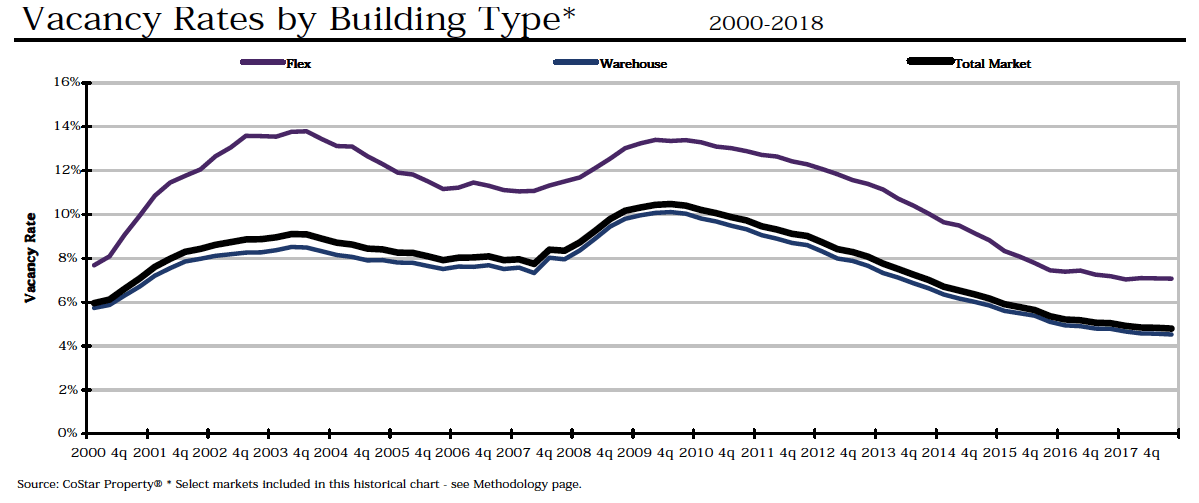
The industrial vacancy rate in the U.S. market area remained at 4.6% at the end of the third quarter 2018. The vacancy rate was 4.6% at the end of the second quarter 2018, 4.7% at the end of the first quarter 2018, and 4.7% at the end of the fourth quarter 2017.
Flex projects reported a vacancy rate of 6.6% at the end of the third quarter 2018, 6.6% at the end of the second quarter 2018, 6.6% at the end of the first quarter 2018, and 6.6% at the end of the fourth quarter 2017.
Warehouse projects reported a vacancy rate of 4.4% at the end of the third quarter 2018, 4.4% at the end of second quarter 2018, 4.4% at the end of the first quarter 2018, and 4.5% at the end of the fourth quarter 2017.
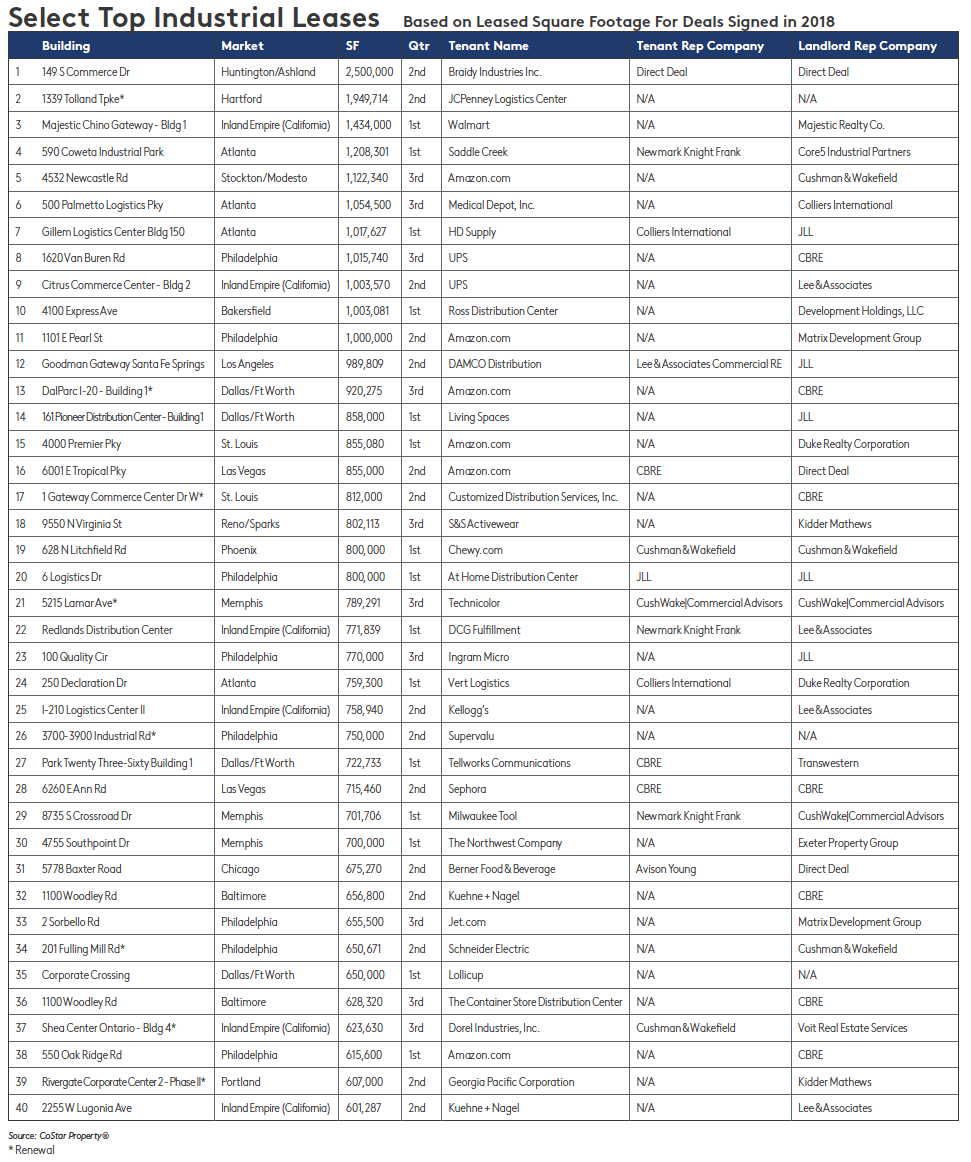
Largest Lease Signings
The largest lease signings occurring in 2018 included: the 628,320-square-foot lease signed by The Container Store Distribution Center at 1100 Woodley Rd in the Baltimore market; the 920,275-square-foot deal signed by Amazon.com at DalParc I-20 – Building 1 in the Dallas/Ft Worth market; and the 1,015,740-square-foot lease signed by UPS at 1620 Van Buren Rd in the Philadelphia market.
Sublease Vacancy
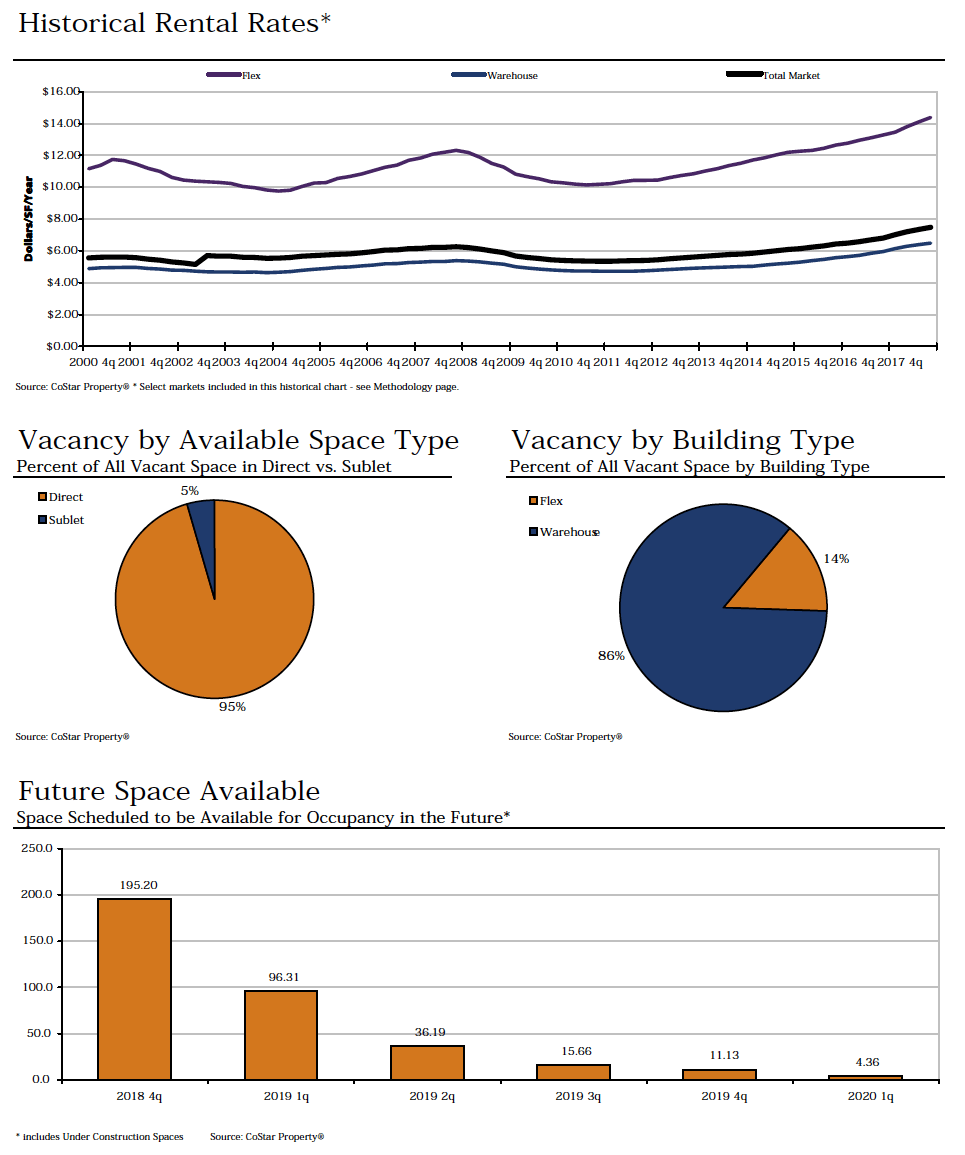
The amount of vacant sublease space in the U.S. market increased to 50,014,041 square feet by the end of the third quarter 2018, from 49,341,526 square feet at the end of the second quarter 2018. There was 42,817,367 square feet vacant at the end of the first quarter 2018 and 39,581,119 square feet at the end of the fourth quarter 2017.
U.S.’s Flex projects reported vacant sublease space of 8,072,382 square feet at the end of third quarter 2018, up from the 7,064,125 square feet reported at the end of the second quarter 2018. There were 6,460,128 square feet of sublease space vacant at the end of the first quarter 2018, and 5,534,792 square feet at the end of the fourth quarter 2017.
Warehouse projects reported decreased vacant sublease space from the second quarter 2018 to the third quarter 2018. Sublease vacancy went from 42,277,401 square feet to 41,941,659 square feet during that time. There was 36,357,239 square feet at the end of the first quarter 2018, and 34,046,327 square feet at the end of the fourth quarter 2017.
Rental Rates
The average quoted asking rental rate for available Industrial space was $6.79 per square foot per year at the end of the third quarter 2018 in the U.S. market area. This represented a 2.1% increase in quoted rental rates from the end of the second quarter 2018, when rents were reported at $6.65 per square foot.
The average quoted rate within the Flex sector was $13.16 per square foot at the end of the third quarter 2018, while Warehouse rates stood at $5.97. At the end of the second quarter 2018, Flex rates were $12.90 per square foot, and Warehouse rates were $5.86.
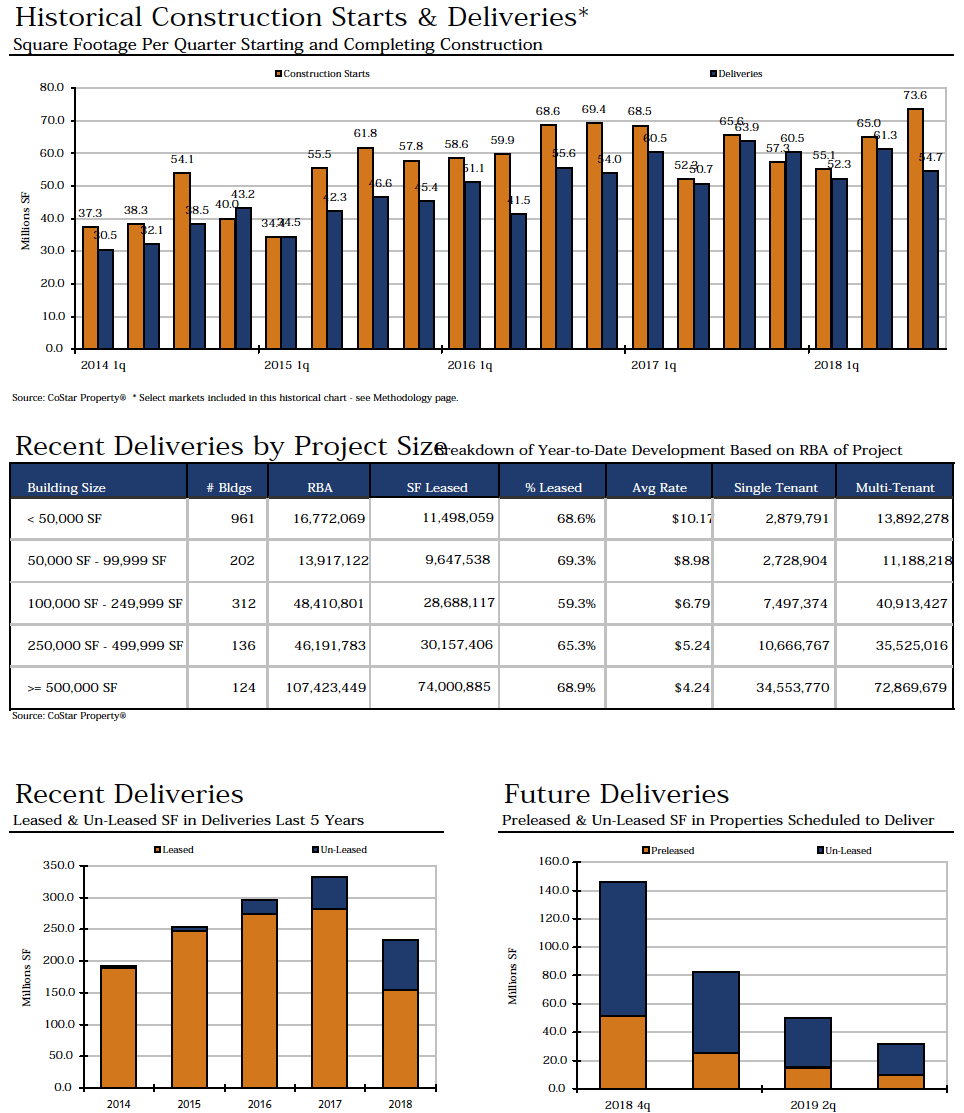
Deliveries and Construction
During the third quarter 2018, 479 buildings totaling 70,407,879 square feet were completed in the U.S. market area. This compares to 474 buildings totaling 86,415,973 square feet that were completed in the second quarter 2018, 665 buildings totaling 71,517,573 square feet completed in the first quarter 2018, and 79,416,524 square feet in 547 buildings completed in the fourth quarter 2017.
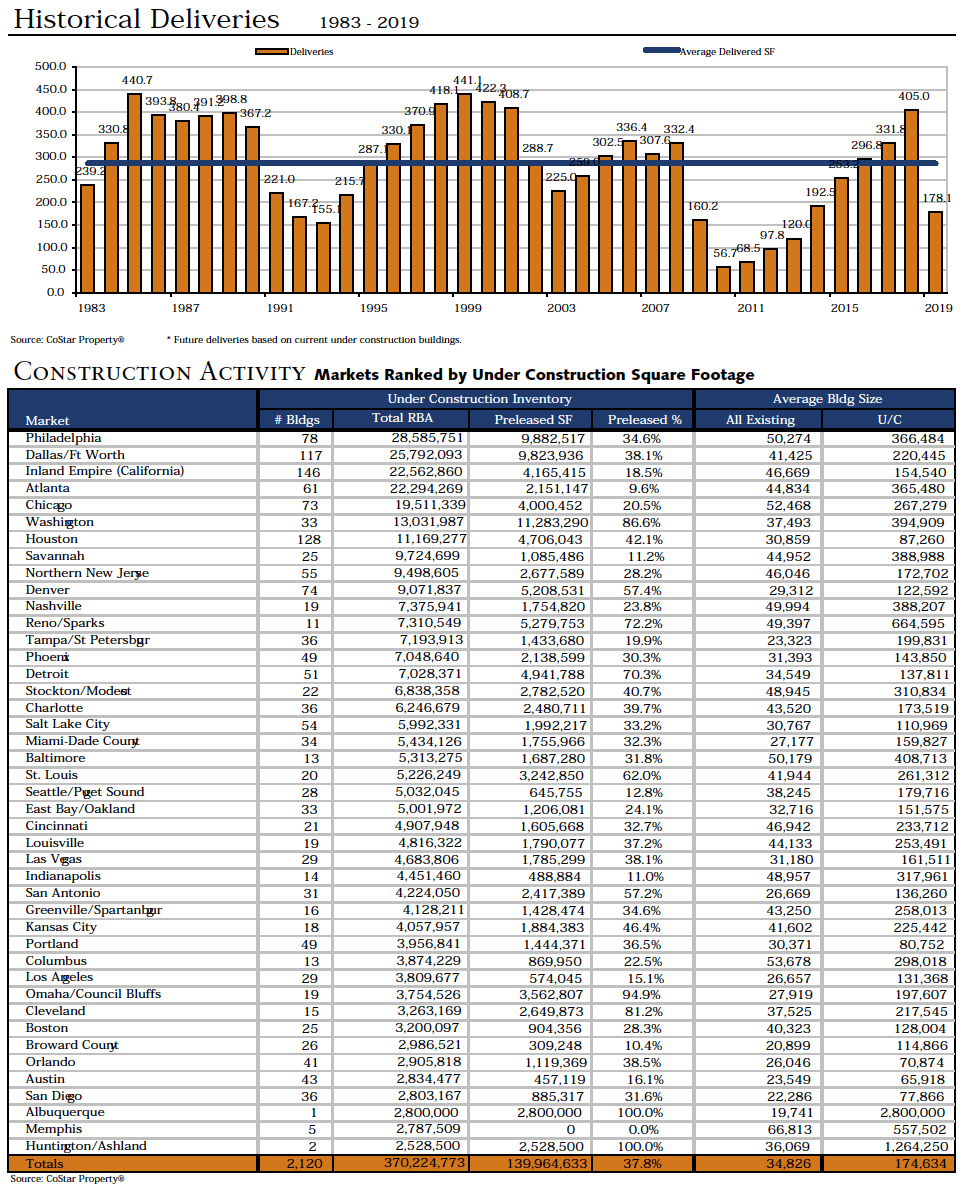
There were 370,224,773 square feet of Industrial space under construction at the end of the third quarter 2018.
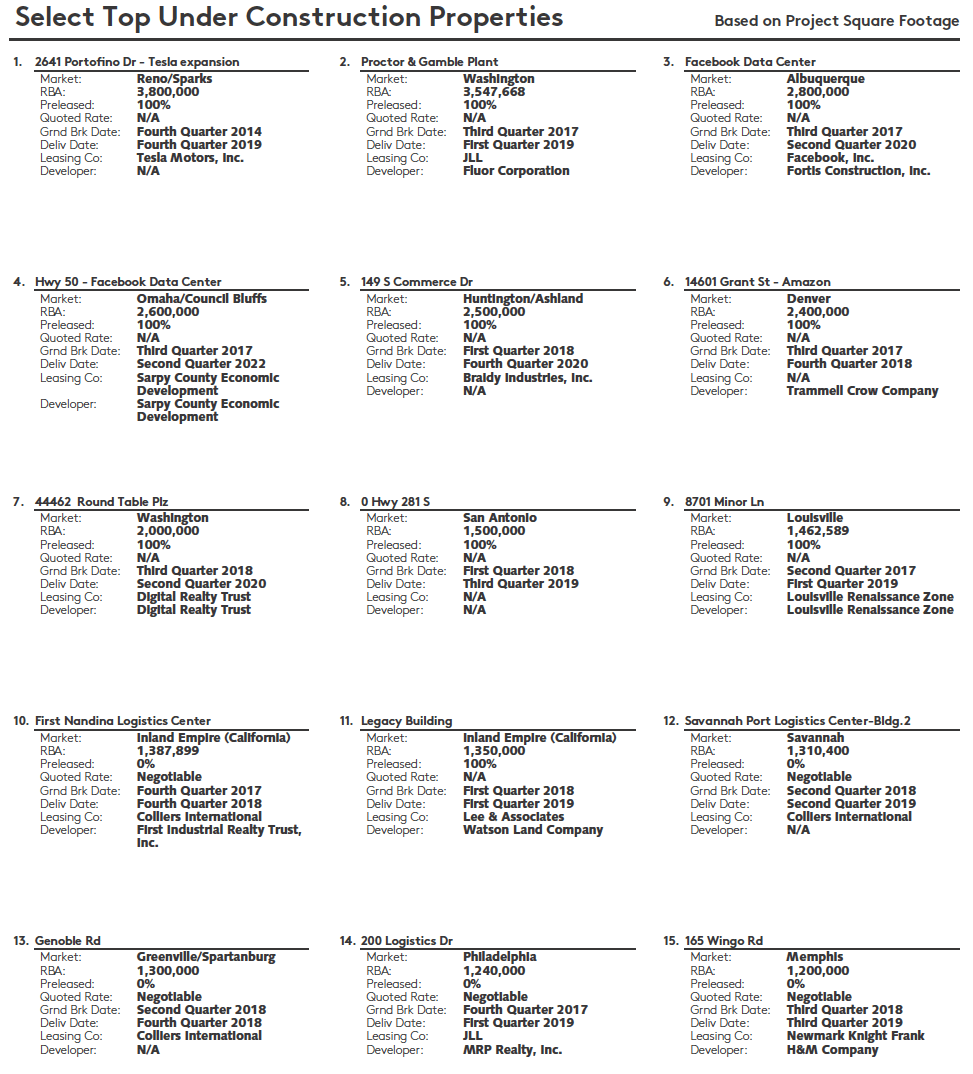
Some of the notable 2018 deliveries include: 8725 County Farm Rd, a 2,594,000-square-foot facility in the Mobile market that delivered in second quarter 2018 and is now 100% occupied, and 15452 Slopertown Rd, a 2,500,000-square-foot building in the Davenport/Moline/Rock Island market that delivered in second quarter 2018 and is now 100% occupied.
The largest projects underway at the end of third quarter 2018 were 2641 Portofino Dr – Tesla expansion in the Reno/Sparks market, a 3,800,000-square-foot building with 100% of its space pre-leased, and Proctor & Gamble Plant, a 3,547,668-square-foot facility that is 100% pre-leased in the Washington DC market.
Inventory
Total Industrial inventory in the U.S. market area amounted to 23,693,802,521 square feet in 680,352 buildings as of the end of the third quarter 2018. The Flex sector consisted of 2,411,704,927 square feet in 96,696 projects. The warehouse sector consisted of 21,282,097,594 square feet in 583,656 buildings. Within the Industrial market there were 72,784 owner-occupied buildings accounting for 4,554,838,378 square feet of Industrial space.
Sales Activity
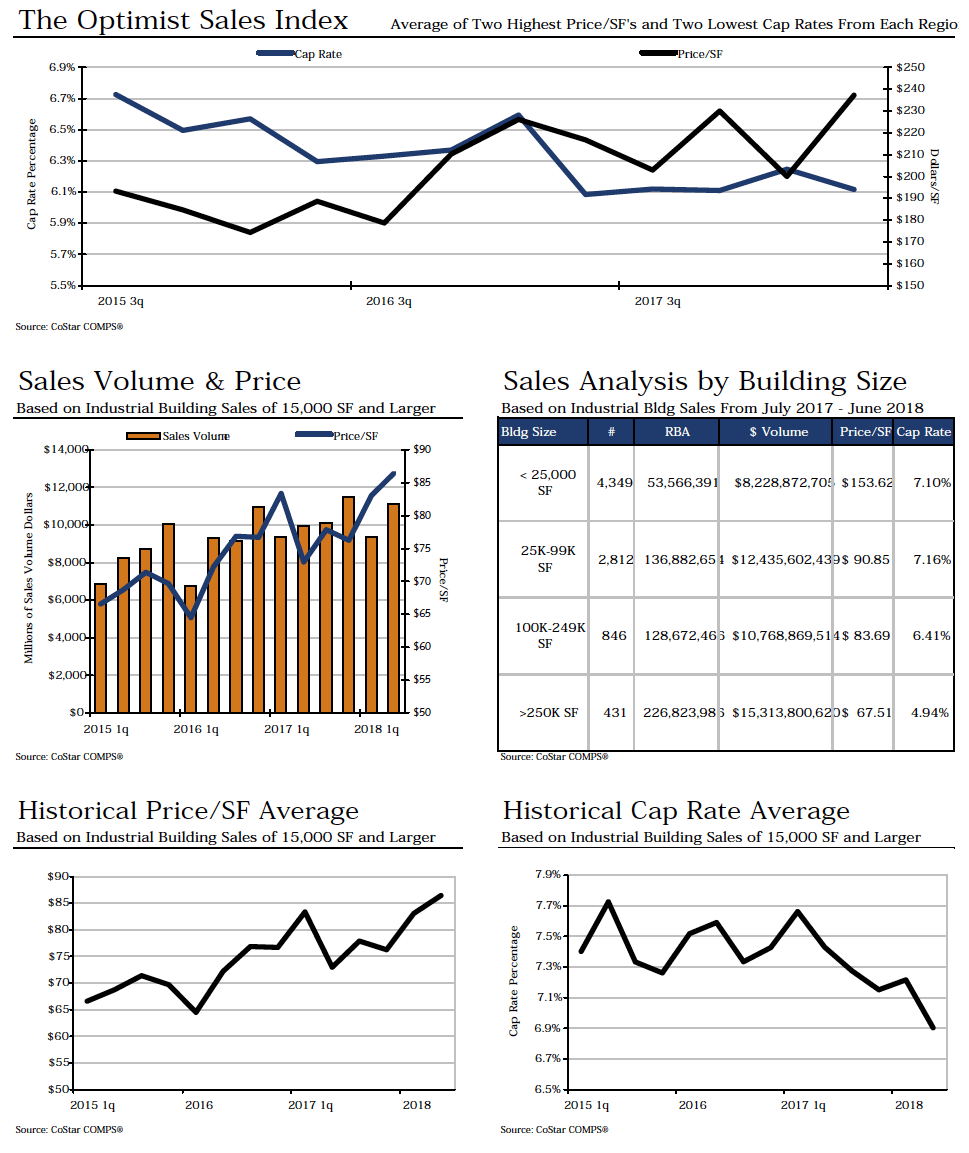
 Tallying industrial building sales of 15,000 square feet or larger, U.S. industrial sales figures rose during the second quarter 2018 in terms of dollar volume compared to the first quarter of 2018.
In the second quarter, 1,471 industrial transactions closed with a total volume of $11,098,292,716. The 1,471 buildings totaled 128,380,762 square feet and the average price per square foot equated to $86.45 per square foot. That compares to 1,302 transactions totaling $9,353,976,130 in the first quarter. The total square footage was 112,623,337 for an average price per square foot of $83.06.
Total year-to-date industrial building sales activity in 2018 is up compared to the previous year. In the first six months of 2018, the market saw 2,773 industrial sales transactions with a total volume of $20,452,268,846. The price per square foot has averaged $84.86 this year. In the first six months of 2017, the market posted 2,822 transactions with a total volume of $19,312,726,472. The price per square foot averaged $77.67.
Cap rates have been lower in 2018, averaging 7.06%, compared to the first six months of last year when they averaged 7.55%.
One of the largest transactions that has occurred within the last 4 quarters in the U.S. market is the sale of Gold Street Technology Center in the South Bay/San Jose market. This 302,212 square foot industrial Center sold for $ 91,500,000, or $ 302.77 per square foot. The property sold on 7/20/2018, at a 6.80% cap rate.
A
Albany/Schenectady/Troy
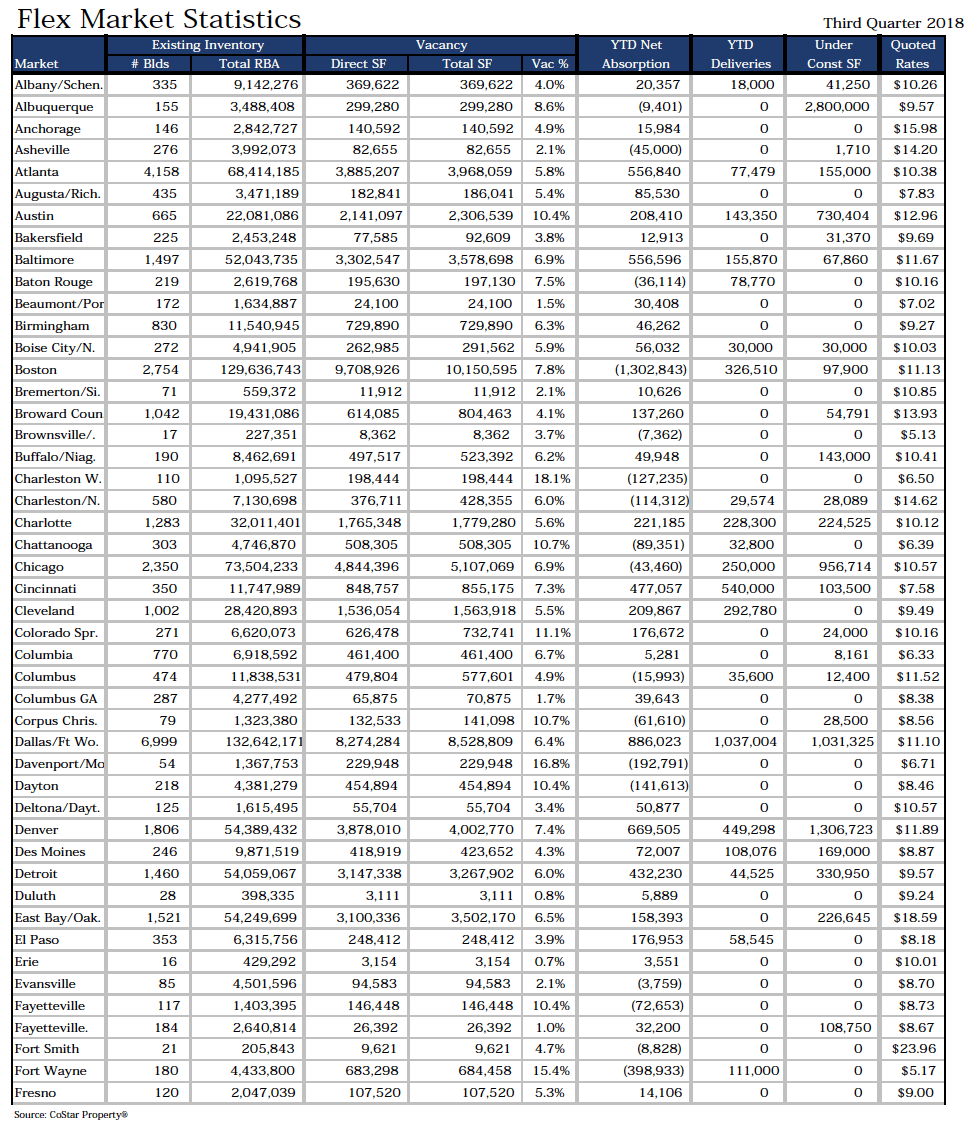
With no new industrial space being delivered to the market, and negative (15,186) square feet of net absorption, Albany/Schenectady/Troy’s vacancy rate went from 2.5% to 2.5% in the quarter. Rental rates went from $5.39 to $5.34 during that time. At the end of the quarter, there was 367,750 square feet underway for future delivery.
Albuquerque
With no new industrial space being delivered to the market, and positive 123,164 square feet of net absorption, Albuquerque’s vacancy rate went from 3.4% to 3.1% in the quarter. Rental rates went from $7.96 to $8.22 during that time. At the end of the quarter, there was 2,800,000 square feet underway for future delivery.
Anchorage
With no new industrial space being delivered to the market, and positive 37,099 square feet of net absorption, Anchorage’s vacancy rate went from 4.0% to 3.8% in the quarter. Rental rates went from $12.26 to $12.13 during that time. At the end of the quarter, there was 20,720 square feet underway for future delivery.
Asheville
With no new industrial space being delivered to the market, and negative (43,662) square feet of net absorption, Asheville’s vacancy rate went from 2.5% to 2.6% in the quarter. Rental rates went from $6.47 to $6.56 during that time. At the end of the quarter, there was 301,710 square feet underway for future delivery.
Atlanta
The Atlanta industrial market saw vacancies fall and rental rates increase from the second quarter 2018 to the third quarter 2018. The overall vacancy rate currently sits at 6.0%, from 6.4% in the previous quarter. Rental rates ended the quarter at $5.07 per square foot, from $4.92 in the previous quarter. There was a total of 4,531,069 square feet that delivered in the quarter, with 22,294,269 square feet still under construction at the end of the quarter.
Augusta/Richmond County
With no new industrial space being delivered to the market, and positive 144,686 square feet of net absorption, Augusta/Richmond County’s vacancy rate went from 8.6% to 8.3% in the quarter. Rental rates went from $3.28 to $3.49 during that time. At the end of the quarter, there was 170,000 square feet underway for future delivery.
Austin
The Austin industrial market saw vacancies fall and rental rates decrease from the second quarter 2018 to the third quarter 2018. The overall vacancy rate currently sits at 6.4%, from 6.6% in the previous quarter. Rental rates ended the quarter at $10.25 per square foot, from $10.33 in the previous quarter. There was a total of 173,955 square feet that delivered in the quarter, with 2,834,477 square feet still under construction at the end of the quarter.
B
Bakersfield
The Bakersfield industrial market saw vacancies fall and rental rates increase from the second quarter 2018 to the third quarter 2018. The overall vacancy rate currently sits at 4.1%, from 4.8% in the previous quarter. Rental rates ended the quarter at $6.86 per square foot, from $6.59 in the previous quarter. There was a total of 50,176 square feet that delivered in the quarter, with 468,125 square feet still under construction at the end of the quarter.
Baltimore
The Baltimore industrial market saw vacancies fall and rental rates increase from the second quarter 2018 to the third quarter 2018. The overall vacancy rate currently sits at 7.8%, from 8.1% in the previous quarter. Rental rates ended the quarter at $5.61 per square foot, from $5.53 in the previous quarter. There was a total of 1,577,414 square feet that delivered in the quarter, with 5,313,275 square feet still under construction at the end of the quarter.
Baton Rouge
The Baton Rouge industrial market saw vacancies rise and rental rates decrease from the second quarter 2018 to the third quarter 2018. The overall vacancy rate currently sits at 4.4%, from 3.7% in the previous quarter. Rental rates ended the quarter at $5.88 per square foot, from $5.96 in the previous quarter. There was a total of 8,770 square feet that delivered in the quarter, with 24,717 square feet still under construction at the end of the quarter.
Beaumont/Port Arthur
The Beaumont/Port Arthur industrial market saw vacancies fall and rental rates decrease from the second quarter 2018 to the third quarter 2018. The overall vacancy rate currently sits at 6.5%, from 6.7% in the previous quarter. Rental rates ended the quarter at $5.72 per square foot, from $5.76 in the previous quarter. There was a total of 4,000 square feet that delivered in the quarter, with 8,846 square feet still under construction at the end of the quarter.
Birmingham
The vacancy rate remained unchanged in Birmingham in the third quarter. With 112,500 square feet in deliveries, and negative (14,568) square feet in net absorption, the vacancy rate held at 3.7%, the same rate reported in the previous quarter. The market had 935,000 square feet under construction at the end of the quarter, and rental rates stood at $3.81 per square foot.
Boise City/Nampa
The Boise City/Nampa industrial market saw vacancies fall and rental rates increase from the second quarter 2018 to the third quarter 2018. The overall vacancy rate currently sits at 3.2%, from 3.6% in the previous quarter. Rental rates ended the quarter at $6.76 per square foot, from $6.70 in the previous quarter. There was a total of 484,152 square feet that delivered in the quarter, with 221,812 square feet still under construction at the end of the quarter.
Boston
The Boston industrial market saw vacancies fall and rental rates increase from the second quarter 2018 to the third quarter 2018. The overall vacancy rate currently sits at 5.3%, from 5.5% in the previous quarter. Rental rates ended the quarter at $7.79 per square foot, from $7.67 in the previous quarter. There was a total of 459,685 square feet that delivered in the quarter, with 3,200,097 square feet still under construction at the end of the quarter.
Bremerton/Silverdale
The Bremerton/Silverdale industrial market reported no new deliveries and no space under construction at the end of the third quarter 2018. With this limited construction activity, net absorption of positive 17,596 square feet caused the vacancy rate decreased from 1.6% to 1.0% in the quarter. Rental rates stood at $10.12.
Broward County
The Broward County industrial market saw vacancies fall and rental rates decrease from the second quarter 2018 to the third quarter 2018. The overall vacancy rate currently sits at 3.7%, from 4.0% in the previous quarter. Rental rates ended the quarter at $9.68 per square foot, from $9.83 in the previous quarter. There was a total of 224,572 square feet that delivered in the quarter, with 2,986,521 square feet still under construction at the end of the quarter.
Brownsville/Harlingen
The Brownsville/Harlingen industrial market saw vacancies rise and rental rates increase from the second quarter 2018 to the third quarter 2018. The overall vacancy rate currently sits at 6.9%, from 6.5% in the previous quarter. Rental rates ended the quarter at $7.32 per square foot, from $7.17 in the previous quarter. There was a total of 32,350 square feet that delivered in the quarter, with 60,000 square feet still under construction at the end of the quarter.
Buffalo/Niagara Falls
The Buffalo/Niagara Falls industrial market saw vacancies rise and rental rates increase from the second quarter 2018 to the third quarter 2018. The overall vacancy rate currently sits at 4.2%, from 3.7% in the previous quarter. Rental rates ended the quarter at $5.55 per square foot, from $5.42 in the previous quarter. There was a total of 219,750 square feet that delivered in the quarter, with 181,115 square feet still under construction at the end of the quarter.
C
Charleston WV
The Charleston WV industrial market reported no new deliveries and no space under construction at the end of the third quarter 2018. With this limited construction activity, net absorption of positive 66,731 square feet caused the vacancy rate decreased from 4.9% to 4.6% in the quarter. Rental rates stood at $5.37.
Charleston/N Charleston
The Charleston/N Charleston industrial market saw vacancies rise and rental rates increase from the second quarter 2018 to the third quarter 2018. The overall vacancy rate currently sits at 7.2%, from 7.1% in the previous quarter. Rental rates ended the quarter at $6.02 per square foot, from $5.98 in the previous quarter. There was a total of 1,450,750 square feet that delivered in the quarter, with 1,885,688 square feet still under construction at the end of the quarter.
Charlotte
The Charlotte industrial market saw vacancies fall and rental rates increase from the second quarter 2018 to the third quarter 2018. The overall vacancy rate currently sits at 4.9%, from 5.2% in the previous quarter. Rental rates ended the quarter at $4.56 per square foot, from $4.42 in the previous quarter. There was a total of 388,905 square feet that delivered in the quarter, with 6,246,679 square feet still under construction at the end of the quarter.
Chattanooga
With no new industrial space being delivered to the market, and negative (493,536) square feet of net absorption, Chattanooga’s vacancy rate went from 4.3% to 5.3% in the quarter. Rental rates went from $4.22 to $3.92 during that time. At the end of the quarter, there was 117,000 square feet underway for future delivery.
Chicago
The Chicago industrial market saw vacancies fall and rental rates increase from the second quarter 2018 to the third quarter 2018. The overall vacancy rate currently sits at 6.1%, from 6.2% in the previous quarter. Rental rates ended the quarter at $5.96 per square foot, from $5.86 in the previous quarter. There was a total of 3,052,458 square feet that delivered in the quarter, with 19,511,339 square feet still under construction at the end of the quarter.
Cincinnati
The vacancy rate remained unchanged in Cincinnati in the third quarter. With 2,144,250 square feet in deliveries, and positive 2,388,431 square feet in net absorption, the vacancy rate held at 3.0%, the same rate reported in the previous quarter. The market had 4,907,948 square feet under construction at the end of the quarter, and rental rates stood at $4.37 per square foot.
Cleveland
The Cleveland industrial market saw vacancies rise and rental rates decrease from the second quarter 2018 to the third quarter 2018. The overall vacancy rate currently sits at 4.0%, from 3.8% in the previous quarter. Rental rates ended the quarter at $4.17 per square foot, from $4.19 in the previous quarter. There was a total of 122,480 square feet that delivered in the quarter, with 3,263,169 square feet still under construction at the end of the quarter.
Colorado Springs
With no new industrial space being delivered to the market, and positive 370,246 square feet of net absorption, Colorado Springs’s vacancy rate went from 8.4% to 7.3% in the quarter. Rental rates went from $8.11 to $8.64 during that time. At the end of the quarter, there was 52,406 square feet underway for future delivery.
Columbia
With no new industrial space being delivered to the market, and positive 136,474 square feet of net absorption, Columbia’s vacancy rate went from 7.6% to 7.4% in the quarter. Rental rates went from $4.32 to $4.23 during that time. At the end of the quarter, there was 1,026,217 square feet underway for future delivery.
Columbus
The Columbus industrial market saw vacancies rise and rental rates increase from the second quarter 2018 to the third quarter 2018. The overall vacancy rate currently sits at 4.7%, from 4.1% in the previous quarter. Rental rates ended the quarter at $4.01 per square foot, from $3.97 in the previous quarter. There was a total of 11,600 square feet that delivered in the quarter, with 3,874,229 square feet still under construction at the end of the quarter.
Columbus GA
The Columbus GA industrial market reported no new deliveries and no space under construction at the end of the third quarter 2018. With this limited construction activity, net absorption of positive 73,835 square feet caused the vacancy rate decreased from 7.6% to 7.5% in the quarter. Rental rates stood at $3.34.
Corpus Christi
The Corpus Christi industrial market saw vacancies rise and rental rates decrease from the second quarter 2018 to the third quarter 2018. The overall vacancy rate currently sits at 5.0%, from 4.9% in the previous quarter. Rental rates ended the quarter at $7.28 per square foot, from $7.40 in the previous quarter. There was a total of 15,250 square feet that delivered in the quarter, with 393,157 square feet still under construction at the end of the quarter.
D
Dallas/Ft Worth
The Dallas/Ft Worth industrial market saw vacancies rise and rental rates increase from the second quarter 2018 to the third quarter 2018. The overall vacancy rate currently sits at 6.0%, from 5.8% in the previous quarter. Rental rates ended the quarter at $6.36 per square foot, from $5.99 in the previous quarter. There was a total of 6,241,805 square feet that delivered in the quarter, with 25,792,093 square feet still under construction at the end of the quarter.
Davenport/Moline/Rock Island
With no new industrial space being delivered to the market, and negative (389,164) square feet of net absorption, Davenport/Moline/Rock Island’s vacancy rate went from 3.3% to 4.3% in the quarter. Rental rates went from $3.55 to $3.64 during that time. At the end of the quarter, there was 100,000 square feet underway for future delivery.
Dayton
With no new industrial space being delivered to the market, and positive 106,528 square feet of net absorption, Dayton’s vacancy rate went from 5.9% to 5.9% in the quarter. Rental rates went from $3.64 to $3.61 during that time. At the end of the quarter, there was 688,726 square feet underway for future delivery.
Deltona/Daytona Beach
The Deltona/Daytona Beach industrial market reported no new deliveries and no space under construction at the end of the third quarter 2018. With this limited construction activity, net absorption of negative (33,258) square feet caused the vacancy rate increased from 1.9% to 2.0% in the quarter. Rental rates stood at $6.63.
Denver
The Denver industrial market saw vacancies rise and rental rates decrease from the second quarter 2018 to the third quarter 2018. The overall vacancy rate currently sits at 4.9%, from 4.7% in the previous quarter. Rental rates ended the quarter at $9.14 per square foot, from $9.32 in the previous quarter. There was a total of 1,020,426 square feet that delivered in the quarter, with 9,071,837 square feet still under construction at the end of the quarter.
Des Moines
The Des Moines industrial market saw vacancies rise and rental rates increase from the second quarter 2018 to the third quarter 2018. The overall vacancy rate currently sits at 3.3%, from 3.1% in the previous quarter. Rental rates ended the quarter at $5.47 per square foot, from $5.42 in the previous quarter. There was a total of 251,200 square feet that delivered in the quarter, with 1,608,116 square feet still under construction at the end of the quarter.
Detroit
The Detroit industrial market saw vacancies rise and rental rates increase from the second quarter 2018 to the third quarter 2018. The overall vacancy rate currently sits at 3.2%, from 3.1% in the previous quarter. Rental rates ended the quarter at $6.07 per square foot, from $5.93 in the previous quarter. There was a total of 1,344,194 square feet that delivered in the quarter, with 7,028,371 square feet still under construction at the end of the quarter.
Duluth
With no space currently under construction, Duluth absorbed (4,328) square feet of space and delivered 2,400 square feet of space, resulting in a vacancy rate that went from 1.2% to 1.3% over the course of the quarter. Rental rates went from $6.10 to $6.10 per square foot.
E
East Bay/Oakland
The East Bay/Oakland industrial market saw vacancies rise and rental rates increase from the second quarter 2018 to the third quarter 2018. The overall vacancy rate currently sits at 4.4%, from 3.9% in the previous quarter. Rental rates ended the quarter at $14.78 per square foot, from $14.31 in the previous quarter. There was a total of 745,820 square feet that delivered in the quarter, with 5,001,972 square feet still under construction at the end of the quarter.
El Paso
The El Paso industrial market saw vacancies fall and rental rates increase from the second quarter 2018 to the third quarter 2018. The overall vacancy rate currently sits at 6.9%, from 8.2% in the previous quarter. Rental rates ended the quarter at $4.49 per square foot, from $4.44 in the previous quarter. There was a total of 20,000 square feet that delivered in the quarter, with 286,400 square feet still under construction at the end of the quarter.
Erie
With no new industrial space being delivered to the market, and negative (10,984) square feet of net absorption, Erie’s vacancy rate went from 4.6% to 4.6% in the quarter. Rental rates went from $4.13 to $4.32 during that time. At the end of the quarter, there was 50,000 square feet underway for future delivery.
Evansville
With no new industrial space being delivered to the market, and negative (105,727) square feet of net absorption, Evansville’s vacancy rate went from 3.3% to 3.6% in the quarter. Rental rates went from $3.89 to $3.99 during that time. At the end of the quarter, there was 100,000 square feet underway for future delivery.
Fayetteville
The Fayetteville industrial market saw vacancies fall and rental rates decrease from the second quarter 2018 to the third quarter 2018. The overall vacancy rate currently sits at 9.1%, from 11.8% in the previous quarter. Rental rates ended the quarter at $4.19 per square foot, from $4.24 in the previous quarter. There was a total of 2,280 square feet that delivered in the quarter, with 627,000 square feet still under construction at the end of the quarter.
F
Fayetteville/Springdale/Rogers
The Fayetteville/Springdale/Rogers industrial market saw vacancies fall and rental rates increase from the second quarter 2018 to the third quarter 2018. The overall vacancy rate currently sits at 5.5%, from 6.4% in the previous quarter. Rental rates ended the quarter at $5.07 per square foot, from $5.06 in the previous quarter. There was a total of 13,500 square feet that delivered in the quarter, with 242,315 square feet still under construction at the end of the quarter.
Fort Smith
The Fort Smith industrial market reported no new deliveries and no space under construction at the end of the third quarter 2018. With this limited construction activity, net absorption of positive 310,832 square feet caused the vacancy rate decreased from 10.2% to 8.8% in the quarter. Rental rates stood at $2.93.
Fort Wayne
With no new industrial space being delivered to the market, and negative (20,470) square feet of net absorption, Fort Wayne’s vacancy rate went from 4.6% to 4.6% in the quarter. Rental rates went from $3.50 to $3.72 during that time. At the end of the quarter, there was 20,000 square feet underway for future delivery.
Fresno
The vacancy rate remained unchanged in Fresno in the third quarter. With 4,907 square feet in deliveries, and negative (29,789) square feet in net absorption, the vacancy rate held at 3.9%, the same rate reported in the previous quarter. The market had 818,278 square feet under construction at the end of the quarter, and rental rates stood at $5.70 per square foot.
G
Green Bay
The vacancy rate remained unchanged in Green Bay in the third quarter. With 39,900 square feet in deliveries, and positive 50,373 square feet in net absorption, the vacancy rate held at 1.6%, the same rate reported in the previous quarter. The market had 116,073 square feet under construction at the end of the quarter, and rental rates stood at $4.28 per square foot.
Greensboro/Winston-Salem
The vacancy rate remained unchanged in Greensboro/Winston-Salem in the third quarter. With 10,000 square feet in deliveries, and positive 2,502 square feet in net absorption, the vacancy rate held at 4.3%, the same rate reported in the previous quarter. The market had 480,210 square feet under construction at the end of the quarter, and rental rates stood at $3.85 per square foot.
Greenville/Spartanburg
The Greenville/Spartanburg industrial market saw vacancies fall and rental rates increase from the second quarter 2018 to the third quarter 2018. The overall vacancy rate currently sits at 5.0%, from 5.1% in the previous quarter. Rental rates ended the quarter at $3.85 per square foot, from $3.77 in the previous quarter. There was a total of 1,138,418 square feet that delivered in the quarter, with 4,128,211 square feet still under construction at the end of the quarter.
H
Hampton Roads
The Hampton Roads industrial market saw vacancies rise and rental rates decrease from the second quarter 2018 to the third quarter 2018. The overall vacancy rate currently sits at 4.0%, from 3.8% in the previous quarter. Rental rates ended the quarter at $6.12 per square foot, from $6.13 in the previous quarter. There was a total of 3,575 square feet that delivered in the quarter, with 721,282 square feet still under construction at the end of the quarter.
Hartford
With no new industrial space being delivered to the market, and negative (109,522) square feet of net absorption, Hartford’s vacancy rate went from 5.4% to 5.4% in the quarter. Rental rates went from $5.12 to $5.34 during that time. At the end of the quarter, there was 1,573,303 square feet underway for future delivery.
Hawaii
The Hawaii industrial market saw vacancies rise and rental rates increase from the second quarter 2018 to the third quarter 2018. The overall vacancy rate currently sits at 2.6%, from 2.4% in the previous quarter. Rental rates ended the quarter at $14.27 per square foot, from $14.01 in the previous quarter. There was a total of 63,906 square feet that delivered in the quarter, with 317,058 square feet still under construction at the end of the quarter.
Houston
The Houston industrial market saw vacancies rise and rental rates increase from the second quarter 2018 to the third quarter 2018. The overall vacancy rate currently sits at 5.8%, from 5.4% in the previous quarter. Rental rates ended the quarter at $7.33 per square foot, from $7.21 in the previous quarter. There was a total of 4,203,736 square feet that delivered in the quarter, with 11,169,277 square feet still under construction at the end of the quarter.
Huntington/Ashland
With no new industrial space being delivered to the market, and positive 51,647 square feet of net absorption, Huntington/Ashland’s vacancy rate went from 3.0% to 2.8% in the quarter. Rental rates went from $3.08 to $3.91 during that time. At the end of the quarter, there was 2,528,500 square feet underway for future delivery.
Huntsville
With no new industrial space being delivered to the market, and negative (16,991) square feet of net absorption, Huntsville’s vacancy rate went from 6.7% to 6.7% in the quarter. Rental rates went from $6.60 to $7.21 during that time. At the end of the quarter, there was 477,600 square feet underway for future delivery.
I
Indianapolis
The Indianapolis industrial market saw vacancies fall and rental rates increase from the second quarter 2018 to the third quarter 2018. The overall vacancy rate currently sits at 3.9%, from 4.5% in the previous quarter. Rental rates ended the quarter at $4.63 per square foot, from $4.61 in the previous quarter. There was a total of 1,251,174 square feet that delivered in the quarter, with 4,451,460 square feet still under construction at the end of the quarter.
Inland Empire (California)
The Inland Empire (California) industrial market saw vacancies rise and rental rates decrease from the second quarter 2018 to the third quarter 2018. The overall vacancy rate currently sits at 4.6%, from 4.3% in the previous quarter. Rental rates ended the quarter at $8.68 per square foot, from $8.77 in the previous quarter. There was a total of 7,547,363 square feet that delivered in the quarter, with 22,562,860 square feet still under construction at the end of the quarter.
J
Jackson
With no new industrial space being delivered to the market, and positive 199,676 square feet of net absorption, Jackson’s vacancy rate went from 5.2% to 4.7% in the quarter. Rental rates went from $4.35 to $3.99 during that time. At the end of the quarter, there was 798,000 square feet underway for future delivery.
Jacksonville (Florida)
The Jacksonville (Florida) industrial market saw vacancies rise and rental rates increase from the second quarter 2018 to the third quarter 2018. The overall vacancy rate currently sits at 2.8%, from 2.6% in the previous quarter. Rental rates ended the quarter at $4.99 per square foot, from $4.93 in the previous quarter. There was a total of 71,600 square feet that delivered in the quarter, with 1,361,691 square feet still under construction at the end of the quarter.
K
Kansas City
The Kansas City industrial market saw vacancies fall and rental rates increase from the second quarter 2018 to the third quarter 2018. The overall vacancy rate currently sits at 4.8%, from 5.0% in the previous quarter. Rental rates ended the quarter at $4.33 per square foot, from $4.30 in the previous quarter. There was a total of 818,638 square feet that delivered in the quarter, with 4,057,957 square feet still under construction at the end of the quarter.
Killeen/Temple/Fort Hood
With no new industrial space being delivered to the market, and negative (229,762) square feet of net absorption, Killeen/Temple/Fort Hood’s vacancy rate went from 2.2% to 5.3% in the quarter. Rental rates went from $4.36 to $4.12 during that time. At the end of the quarter, there was 42,002 square feet underway for future delivery.
Kingsport/Bristol/Bristol
The Kingsport/Bristol/Bristol industrial market reported no new deliveries and no space under construction at the end of the third quarter 2018. With this limited construction activity, net absorption of positive 5,030 square feet caused the vacancy rate to unchanged from 1.2% to 1.2% in the quarter. Rental rates stood at $2.98.
Knoxville
The Knoxville industrial market saw vacancies rise and rental rates increase from the second quarter 2018 to the third quarter 2018. The overall vacancy rate currently sits at 2.5%, from 2.3% in the previous quarter. Rental rates ended the quarter at $4.69 per square foot, from $4.53 in the previous quarter. There was a total of 248,300 square feet that delivered in the quarter, with 261,500 square feet still under construction at the end of the quarter.
L
Lafayette
The Lafayette industrial market saw vacancies fall and rental rates increase from the second quarter 2018 to the third quarter 2018. The overall vacancy rate currently sits at 5.0%, from 6.7% in the previous quarter. Rental rates ended the quarter at $6.19 per square foot, from $4.75 in the previous quarter. There was a total of 20,000 square feet that delivered in the quarter, with 6,800 square feet still under construction at the end of the quarter.
Las Vegas
The Las Vegas industrial market saw vacancies rise and rental rates decrease from the second quarter 2018 to the third quarter 2018. The overall vacancy rate currently sits at 4.9%, from 4.7% in the previous quarter. Rental rates ended the quarter at $7.12 per square foot, from $7.27 in the previous quarter. There was a total of 804,845 square feet that delivered in the quarter, with 4,683,806 square feet still under construction at the end of the quarter.
Lexington/Fayette
With no space currently under construction, Lexington/Fayette absorbed 360,111 square feet of space and delivered 20,000 square feet of space, resulting in a vacancy rate that went from 4.3% to 3.7% over the course of the quarter. Rental rates went from $5.47 to $5.71 per square foot.
Lincoln
With no new industrial space being delivered to the market, and negative (84,863) square feet of net absorption, Lincoln’s vacancy rate went from 3.7% to 4.0% in the quarter. Rental rates went from $5.01 to $4.93 during that time. At the end of the quarter, there was 55,000 square feet underway for future delivery.
Little Rock/N Little Rock
The Little Rock/N Little Rock industrial market saw vacancies fall and rental rates increase from the second quarter 2018 to the third quarter 2018. The overall vacancy rate currently sits at 4.8%, from 5.4% in the previous quarter. Rental rates ended the quarter at $3.79 per square foot, from $3.60 in the previous quarter. There was a total of 6,900 square feet that delivered in the quarter, with 126,200 square feet still under construction at the end of the quarter.
Long Island (New York)
The Long Island (New York) industrial market saw vacancies rise and rental rates decrease from the second quarter 2018 to the third quarter 2018. The overall vacancy rate currently sits at 4.6%, from 4.3% in the previous quarter. Rental rates ended the quarter at $17.30 per square foot, from $17.54 in the previous quarter. There was a total of 57,800 square feet that delivered in the quarter, with 2,066,321 square feet still under construction at the end of the quarter.
Los Angeles
The vacancy rate remained unchanged in Los Angeles in the third quarter. With 1,444,308 square feet in deliveries, and positive 1,003,041 square feet in net absorption, the vacancy rate held at 2.7%, the same rate reported in the previous quarter. The market had 3,809,677 square feet under construction at the end of the quarter, and rental rates stood at $11.96 per square foot.
Louisville
The Louisville industrial market saw vacancies rise and rental rates increase from the second quarter 2018 to the third quarter 2018. The overall vacancy rate currently sits at 5.9%, from 5.5% in the previous quarter. Rental rates ended the quarter at $3.97 per square foot, from $3.94 in the previous quarter. There was a total of 856,177 square feet that delivered in the quarter, with 4,816,322 square feet still under construction at the end of the quarter.
Lubbock
With no new industrial space being delivered to the market, and negative (103,966) square feet of net absorption, Lubbock’s vacancy rate went from 1.5% to 1.7% in the quarter. Rental rates went from $4.15 to $4.36 during that time. At the end of the quarter, there was 40,000 square feet underway for future delivery.
M
Madison
The Madison industrial market saw vacancies fall and rental rates increase from the second quarter 2018 to the third quarter 2018. The overall vacancy rate currently sits at 3.1%, from 3.4% in the previous quarter. Rental rates ended the quarter at $5.41 per square foot, from $4.92 in the previous quarter. There was a total of 130,000 square feet that delivered in the quarter, with 1,179,494 square feet still under construction at the end of the quarter.
McAllen/Edinburg/Pharr
The McAllen/Edinburg/Pharr industrial market saw vacancies fall and rental rates increase from the second quarter 2018 to the third quarter 2018. The overall vacancy rate currently sits at 6.6%, from 7.0% in the previous quarter. Rental rates ended the quarter at $5.58 per square foot, from $5.53 in the previous quarter. There was a total of 12,000 square feet that delivered in the quarter, with 174,630 square feet still under construction at the end of the quarter.
Memphis
The Memphis industrial market saw vacancies fall and rental rates increase from the second quarter 2018 to the third quarter 2018. The overall vacancy rate currently sits at 6.6%, from 6.9% in the previous quarter. Rental rates ended the quarter at $3.76 per square foot, from $3.71 in the previous quarter. There was a total of 1,236,475 square feet that delivered in the quarter, with 2,787,509 square feet still under construction at the end of the quarter.
Miami-Dade County
The Miami-Dade County industrial market saw vacancies fall and rental rates increase from the second quarter 2018 to the third quarter 2018. The overall vacancy rate currently sits at 3.8%, from 3.9% in the previous quarter. Rental rates ended the quarter at $10.59 per square foot, from $10.32 in the previous quarter. There was a total of 1,332,445 square feet that delivered in the quarter, with 5,434,126 square feet still under construction at the end of the quarter.
Milwaukee
The Milwaukee industrial market saw vacancies rise and rental rates increase from the second quarter 2018 to the third quarter 2018. The overall vacancy rate currently sits at 4.0%, from 3.8% in the previous quarter. Rental rates ended the quarter at $4.63 per square foot, from $4.39 in the previous quarter. There was a total of 295,670 square feet that delivered in the quarter, with 937,198 square feet still under construction at the end of the quarter.
Minneapolis
The Minneapolis industrial market saw vacancies fall and rental rates increase from the second quarter 2018 to the third quarter 2018. The overall vacancy rate currently sits at 3.5%, from 3.6% in the previous quarter. Rental rates ended the quarter at $6.87 per square foot, from $6.71 in the previous quarter. There was a total of 107,418 square feet that delivered in the quarter, with 2,459,190 square feet still under construction at the end of the quarter.
Mobile
With no new industrial space being delivered to the market, and positive 91,269 square feet of net absorption, Mobile’s vacancy rate went from 4.8% to 4.5% in the quarter. Rental rates went from $4.47 to $4.54 during that time. At the end of the quarter, there was 261,250 square feet underway for future delivery.
Montgomery
The Montgomery industrial market reported no new deliveries and no space under construction at the end of the third quarter 2018. With this limited construction activity, net absorption of negative (97,365) square feet caused the vacancy rate increased from 7.3% to 7.6% in the quarter. Rental rates stood at $4.85.
Myrtle Beach/Conway
The Myrtle Beach/Conway industrial market saw vacancies fall and rental rates increase from the second quarter 2018 to the third quarter 2018. The overall vacancy rate currently sits at 2.9%, from 3.6% in the previous quarter. Rental rates ended the quarter at $5.06 per square foot, from $4.98 in the previous quarter. There was a total of 40,277 square feet that delivered in the quarter, with 3,678 square feet still under construction at the end of the quarter.
N
Nashville
The Nashville industrial market saw vacancies rise and rental rates decrease from the second quarter 2018 to the third quarter 2018. The overall vacancy rate currently sits at 3.3%, from 3.0% in the previous quarter. Rental rates ended the quarter at $5.54 per square foot, from $5.67 in the previous quarter. There was a total of 618,500 square feet that delivered in the quarter, with 7,375,941 square feet still under construction at the end of the quarter.
New Orleans/Metairie/Kenner
The New Orleans/Metairie/Kenner industrial market reported no new deliveries and no space under construction at the end of the third quarter 2018. With this limited construction activity, net absorption of negative (202,760) square feet caused the vacancy rate increased from 3.3% to 3.6% in the quarter. Rental rates stood at $5.75.
North Bay/Santa Rosa
The North Bay/Santa Rosa industrial market saw vacancies rise and rental rates increase from the second quarter 2018 to the third quarter 2018. The overall vacancy rate currently sits at 4.0%, from 3.4% in the previous quarter. Rental rates ended the quarter at $12.64 per square foot, from $11.05 in the previous quarter. There was a total of 120,080 square feet that delivered in the quarter, with 1,889,542 square feet still under construction at the end of the quarter.
Northern New Jersey
The Northern New Jersey industrial market saw vacancies fall and rental rates increase from the second quarter 2018 to the third quarter 2018. The overall vacancy rate currently sits at 4.2%, from 4.5% in the previous quarter. Rental rates ended the quarter at $8.43 per square foot, from $8.29 in the previous quarter. There was a total of 3,935,153 square feet that delivered in the quarter, with 9,498,605 square feet still under construction at the end of the quarter.
O
Ocala
With no new industrial space being delivered to the market, and positive 6,007 square feet of net absorption, Ocala’s vacancy rate went from 4.3% to 4.3% in the quarter. Rental rates went from $4.33 to $4.58 during that time. At the end of the quarter, there was 451,415 square feet underway for future delivery.
Oklahoma City
The Oklahoma City industrial market saw vacancies fall and rental rates increase from the second quarter 2018 to the third quarter 2018. The overall vacancy rate currently sits at 3.7%, from 3.8% in the previous quarter. Rental rates ended the quarter at $5.88 per square foot, from $5.71 in the previous quarter. There was a total of 15,000 square feet that delivered in the quarter, with 259,357 square feet still under construction at the end of the quarter.
Olympia
The Olympia industrial market saw vacancies rise and rental rates decrease from the second quarter 2018 to the third quarter 2018. The overall vacancy rate currently sits at 5.1%, from 2.0% in the previous quarter. Rental rates ended the quarter at $5.60 per square foot, from $5.63 in the previous quarter. There was a total of 383,278 square feet that delivered in the quarter, with 226,550 square feet still under construction at the end of the quarter.
Omaha/Council Bluffs
The Omaha/Council Bluffs industrial market saw vacancies rise and rental rates increase from the second quarter 2018 to the third quarter 2018. The overall vacancy rate currently sits at 3.0%, from 2.6% in the previous quarter. Rental rates ended the quarter at $5.78 per square foot, from $5.61 in the previous quarter. There was a total of 473,574 square feet that delivered in the quarter, with 3,754,526 square feet still under construction at the end of the quarter.
Orange County (California)
With no new industrial space being delivered to the market, and negative (690,651) square feet of net absorption, Orange County (California)’s vacancy rate went from 2.4% to 2.6% in the quarter. Rental rates went from $12.55 to $12.77 during that time. At the end of the quarter, there was 1,467,384 square feet underway for future delivery.
Orlando
The Orlando industrial market saw vacancies rise and rental rates increase from the second quarter 2018 to the third quarter 2018. The overall vacancy rate currently sits at 4.2%, from 4.0% in the previous quarter. Rental rates ended the quarter at $6.91 per square foot, from $6.82 in the previous quarter. There was a total of 1,179,456 square feet that delivered in the quarter, with 2,905,818 square feet still under construction at the end of the quarter.
P
Palm Beach County
The vacancy rate remained unchanged in Palm Beach County in the third quarter. With 38,069 square feet in deliveries, and positive 29,999 square feet in net absorption, the vacancy rate held at 2.8%, the same rate reported in the previous quarter. The market had 477,553 square feet under construction at the end of the quarter, and rental rates stood at $10.42 per square foot.
Pensacola
The Pensacola industrial market reported no new deliveries and no space under construction at the end of the third quarter 2018. With this limited construction activity, net absorption of positive 29,884 square feet caused the vacancy rate decreased from 4.1% to 3.8% in the quarter. Rental rates stood at $5.57. Peoria The Peoria industrial market reported no new deliveries and no space under construction at the end of the third quarter 2018. With this limited construction activity, net absorption of negative (40,708) square feet caused the vacancy rate increased from 3.1% to 3.2% in the quarter. Rental rates stood at $4.37.
Philadelphia
The Philadelphia industrial market saw vacancies fall and rental rates increase from the second quarter 2018 to the third quarter 2018. The overall vacancy rate currently sits at 5.4%, from 5.6% in the previous quarter. Rental rates ended the quarter at $5.36 per square foot, from $5.26 in the previous quarter. There was a total of 3,513,772 square feet that delivered in the quarter, with 28,585,751 square feet still under construction at the end of the quarter.
Phoenix
The Phoenix industrial market saw vacancies rise and rental rates change from the second quarter 2018 to the third quarter 2018. The overall vacancy rate currently sits at 7.0%, from 6.8% in the previous quarter. Rental rates ended the quarter at $7.24 per square foot, from $7.24 in the previous quarter. There was a total of 1,581,478 square feet that delivered in the quarter, with 7,048,640 square feet still under construction at the end of the quarter.
Pittsburgh
The Pittsburgh industrial market saw vacancies rise and rental rates increase from the second quarter 2018 to the third quarter 2018. The overall vacancy rate currently sits at 6.0%, from 5.9% in the previous quarter. Rental rates ended the quarter at $6.09 per square foot, from $5.98 in the previous quarter. There was a total of 28,200 square feet that delivered in the quarter, with 1,678,400 square feet still under construction at the end of the quarter.
Port St Lucie/Fort Pierce
The Port St Lucie/Fort Pierce industrial market saw vacancies rise and rental rates increase from the second quarter 2018 to the third quarter 2018. The overall vacancy rate currently sits at 4.5%, from 4.2% in the previous quarter. Rental rates ended the quarter at $7.68 per square foot, from $7.46 in the previous quarter. There was a total of 17,840 square feet that delivered in the quarter, with 273,736 square feet still under construction at the end of the quarter.
Portland
The Portland industrial market saw vacancies fall and rental rates increase from the second quarter 2018 to the third quarter 2018. The overall vacancy rate currently sits at 3.4%, from 3.6% in the previous quarter. Rental rates ended the quarter at $8.18 per square foot, from $8.08 in the previous quarter. There was a total of 2,080,890 square feet that delivered in the quarter, with 3,956,841 square feet still under construction at the end of the quarter.
Portland/South Portland
With no new industrial space being delivered to the market, and negative (42,495) square feet of net absorption, Portland/South Portland’s vacancy rate went from 1.8% to 2.0% in the quarter. Rental rates went from $6.22 to $6.39 during that time. At the end of the quarter, there was 88,531 square feet underway for future delivery.
Providence
The Providence industrial market saw vacancies fall and rental rates increase from the second quarter 2018 to the third quarter 2018. The overall vacancy rate currently sits at 3.6%, from 3.8% in the previous quarter. Rental rates ended the quarter at $5.47 per square foot, from $5.36 in the previous quarter. There was a total of 9,500 square feet that delivered in the quarter, with 39,673 square feet still under construction at the end of the quarter.
R
Raleigh/Durham
The Raleigh/Durham industrial market saw vacancies fall and rental rates increase from the second quarter 2018 to the third quarter 2018. The overall vacancy rate currently sits at 5.1%, from 5.2% in the previous quarter. Rental rates ended the quarter at $7.24 per square foot, from $7.13 in the previous quarter. There was a total of 380,200 square feet that delivered in the quarter, with 1,778,284 square feet still under construction at the end of the quarter.
Reno/Sparks
The Reno/Sparks industrial market saw vacancies fall and rental rates increase from the second quarter 2018 to the third quarter 2018. The overall vacancy rate currently sits at 6.5%, from 6.7% in the previous quarter. Rental rates ended the quarter at $5.00 per square foot, from $4.91 in the previous quarter. There was a total of 59,209 square feet that delivered in the quarter, with 7,310,549 square feet still under construction at the end of the quarter.
Richmond VA
The Richmond VA industrial market saw vacancies fall and rental rates increase from the second quarter 2018 to the third quarter 2018. The overall vacancy rate currently sits at 3.9%, from 4.3% in the previous quarter. Rental rates ended the quarter at $5.33 per square foot, from $5.22 in the previous quarter. There was a total of 1,121,147 square feet that delivered in the quarter, with 1,578,657 square feet still under construction at the end of the quarter.
Roanoke
The Roanoke industrial market reported no new deliveries and no space under construction at the end of the third quarter 2018. With this limited construction activity, net absorption of positive 59,125 square feet caused the vacancy rate decreased from 5.2% to 5.1% in the quarter. Rental rates stood at $4.06.
Rochester
The Rochester industrial market saw vacancies fall and rental rates increase from the second quarter 2018 to the third quarter 2018. The overall vacancy rate currently sits at 5.5%, from 5.6% in the previous quarter. Rental rates ended the quarter at $5.58 per square foot, from $5.49 in the previous quarter. There was a total of 40,800 square feet that delivered in the quarter, with 100,000 square feet still under construction at the end of the quarter.
S
Sacramento
With no new industrial space being delivered to the market, and positive 417,092 square feet of net absorption, Sacramento’s vacancy rate went from 4.9% to 4.6% in the quarter. Rental rates went from $6.73 to $6.85 during that time. At the end of the quarter, there was 949,809 square feet underway for future delivery.
Salinas
The Salinas industrial market saw vacancies fall and rental rates increase from the second quarter 2018 to the third quarter 2018. The overall vacancy rate currently sits at 2.0%, from 4.1% in the previous quarter. Rental rates ended the quarter at $7.45 per square foot, from $7.06 in the previous quarter. There was a total of 7,000 square feet that delivered in the quarter, with 248,113 square feet still under construction at the end of the quarter.
Salt Lake City
The Salt Lake City industrial market saw vacancies fall and rental rates decrease from the second quarter 2018 to the third quarter 2018. The overall vacancy rate currently sits at 3.5%, from 3.8% in the previous quarter. Rental rates ended the quarter at $6.10 per square foot, from $6.11 in the previous quarter. There was a total of 1,059,578 square feet that delivered in the quarter, with 5,992,331 square feet still under construction at the end of the quarter.
San Antonio
The San Antonio industrial market saw vacancies rise and rental rates decrease from the second quarter 2018 to the third quarter 2018. The overall vacancy rate currently sits at 6.2%, from 5.9% in the previous quarter. Rental rates ended the quarter at $6.67 per square foot, from $6.79 in the previous quarter. There was a total of 429,095 square feet that delivered in the quarter, with 4,224,050 square feet still under construction at the end of the quarter.
San Diego
The San Diego industrial market saw vacancies fall and rental rates increase from the second quarter 2018 to the third quarter 2018. The overall vacancy rate currently sits at 4.4%, from 4.5% in the previous quarter. Rental rates ended the quarter at $13.64 per square foot, from $13.28 in the previous quarter. There was a total of 372,484 square feet that delivered in the quarter, with 2,803,167 square feet still under construction at the end of the quarter.
San Francisco
The San Francisco industrial market saw vacancies rise and rental rates increase from the second quarter 2018 to the third quarter 2018. The overall vacancy rate currently sits at 3.5%, from 2.8% in the previous quarter. Rental rates ended the quarter at $28.17 per square foot, from $26.67 in the previous quarter. There was a total of 46,500 square feet that delivered in the quarter, with 1,826,251 square feet still under construction at the end of the quarter.
San Luis Obispo/Paso Robles
With no new industrial space being delivered to the market, and negative (2,843) square feet of net absorption, San Luis Obispo/Paso Robles’s vacancy rate went from 2.9% to 3.0% in the quarter. Rental rates went from $14.15 to $15.52 during that time. At the end of the quarter, there was 41,725 square feet underway for future delivery.
Santa Barbara/Sta Maria/Goleta
With no new industrial space being delivered to the market, and positive 24,518 square feet of net absorption, Santa Barbara/Sta Maria/Goleta’s vacancy rate went from 4.2% to 4.1% in the quarter. Rental rates went from $15.20 to $14.33 during that time. At the end of the quarter, there was 180,562 square feet underway for future delivery.
Santa Cruz/Watsonville
The Santa Cruz/Watsonville industrial market reported no new deliveries and no space under construction at the end of the third quarter 2018. With this limited construction activity, net absorption of positive 69,053 square feet caused the vacancy rate decreased from 2.0% to 1.4% in the quarter. Rental rates stood at $12.99.
Savannah
The Savannah industrial market saw vacancies rise and rental rates decrease from the second quarter 2018 to the third quarter 2018. The overall vacancy rate currently sits at 2.1%, from 1.3% in the previous quarter. Rental rates ended the quarter at $4.72 per square foot, from $4.91 in the previous quarter. There was a total of 506,800 square feet that delivered in the quarter, with 9,724,699 square feet still under construction at the end of the quarter.
Seattle/Puget Sound
The Seattle/Puget Sound industrial market saw vacancies rise and rental rates decrease from the second quarter 2018 to the third quarter 2018. The overall vacancy rate currently sits at 3.3%, from 3.2% in the previous quarter. Rental rates ended the quarter at $10.15 per square foot, from $10.17 in the previous quarter. There was a total of 1,356,756 square feet that delivered in the quarter, with 5,032,045 square feet still under construction at the end of the quarter.
Shreveport/Bossier City
The Shreveport/Bossier City industrial market saw vacancies rise and rental rates decrease from the second quarter 2018 to the third quarter 2018. The overall vacancy rate currently sits at 13.4%, from 13.3% in the previous quarter. Rental rates ended the quarter at $3.26 per square foot, from $3.34 in the previous quarter. There was a total of 25,000 square feet that delivered in the quarter, with 9,500 square feet still under construction at the end of the quarter.
South Bay/San Jose
The South Bay/San Jose industrial market saw vacancies fall and rental rates decrease from the second quarter 2018 to the third quarter 2018. The overall vacancy rate currently sits at 6.0%, from 6.2% in the previous quarter. Rental rates ended the quarter at $23.13 per square foot, from $23.19 in the previous quarter. There was a total of 168,097 square feet that delivered in the quarter, with 526,000 square feet still under construction at the end of the quarter.
South Bend/Mishawaka
The South Bend/Mishawaka industrial market saw vacancies rise and rental rates increase from the second quarter 2018 to the third quarter 2018. The overall vacancy rate currently sits at 3.1%, from 2.7% in the previous quarter. Rental rates ended the quarter at $3.99 per square foot, from $3.98 in the previous quarter. There was a total of 227,358 square feet that delivered in the quarter, with 230,000 square feet still under construction at the end of the quarter.
Southwest Florida
The Southwest Florida industrial market saw vacancies rise and rental rates increase from the second quarter 2018 to the third quarter 2018. The overall vacancy rate currently sits at 2.9%, from 2.3% in the previous quarter. Rental rates ended the quarter at $8.71 per square foot, from $8.49 in the previous quarter. There was a total of 12,900 square feet that delivered in the quarter, with 979,089 square feet still under construction at the end of the quarter.
Spokane
With no new industrial space being delivered to the market, and negative (38,337) square feet of net absorption, Spokane’s vacancy rate went from 1.9% to 1.9% in the quarter. Rental rates went from $6.84 to $7.03 during that time. At the end of the quarter, there was 233,145 square feet underway for future delivery.
Springfield
The Springfield industrial market saw vacancies fall and rental rates decrease from the second quarter 2018 to the third quarter 2018. The overall vacancy rate currently sits at 4.4%, from 4.7% in the previous quarter. Rental rates ended the quarter at $4.43 per square foot, from $4.50 in the previous quarter. There was a total of 130,000 square feet that delivered in the quarter, with 43,875 square feet still under construction at the end of the quarter.
St. Louis
The St. Louis industrial market saw vacancies fall and rental rates change from the second quarter 2018 to the third quarter 2018. The overall vacancy rate currently sits at 4.2%, from 4.8% in the previous quarter. Rental rates ended the quarter at $4.69 per square foot, from $4.69 in the previous quarter. There was a total of 209,822 square feet that delivered in the quarter, with 5,226,249 square feet still under construction at the end of the quarter.
Stockton/Modesto
The Stockton/Modesto industrial market saw vacancies rise and rental rates increase from the second quarter 2018 to the third quarter 2018. The overall vacancy rate currently sits at 4.5%, from 4.1% in the previous quarter. Rental rates ended the quarter at $5.82 per square foot, from $5.63 in the previous quarter. There was a total of 1,648,202 square feet that delivered in the quarter, with 6,838,358 square feet still under construction at the end of the quarter.
Syracuse
The Syracuse industrial market saw vacancies rise and rental rates change from the second quarter 2018 to the third quarter 2018. The overall vacancy rate currently sits at 5.2%, from 4.1% in the previous quarter. Rental rates ended the quarter at $4.18 per square foot, from $4.18 in the previous quarter. There was a total of 20,000 square feet that delivered in the quarter, with 186,000 square feet still under construction at the end of the quarter.
T
Tallahassee
With no new industrial space being delivered to the market, and positive 1,023 square feet of net absorption, Tallahassee’s vacancy rate went from 2.4% to 2.4% in the quarter. Rental rates went from $5.47 to $4.98 during that time. At the end of the quarter, there was 2,850 square feet underway for future delivery.
Tampa/St Petersburg
The Tampa/St Petersburg industrial market saw vacancies fall and rental rates increase from the second quarter 2018 to the third quarter 2018. The overall vacancy rate currently sits at 4.4%, from 4.6% in the previous quarter. Rental rates ended the quarter at $6.34 per square foot, from $6.16 in the previous quarter. There was a total of 426,843 square feet that delivered in the quarter, with 7,193,913 square feet still under construction at the end of the quarter.
Toledo
The Toledo industrial market saw vacancies fall and rental rates change from the second quarter 2018 to the third quarter 2018. The overall vacancy rate currently sits at 1.9%, from 2.3% in the previous quarter. Rental rates ended the quarter at $3.39 per square foot, from $3.39 in the previous quarter. There was a total of 790,000 square feet that delivered in the quarter, with 122,000 square feet still under construction at the end of the quarter.
Tucson
With no new industrial space being delivered to the market, and positive 275,254 square feet of net absorption, Tucson’s vacancy rate went from 6.6% to 5.9% in the quarter. Rental rates went from $6.48 to $6.53 during that time. At the end of the quarter, there was 251,534 square feet underway for future delivery.
Tulsa
The Tulsa industrial market saw vacancies rise and rental rates increase from the second quarter 2018 to the third quarter 2018. The overall vacancy rate currently sits at 4.1%, from 3.7% in the previous quarter. Rental rates ended the quarter at $4.84 per square foot, from $4.81 in the previous quarter. There was a total of 35,000 square feet that delivered in the quarter, with 528,548 square feet still under construction at the end of the quarter.
U
Utica/Rome
With no new industrial space being delivered to the market, and positive 16,600 square feet of net absorption, Utica/Rome’s vacancy rate went from 1.7% to 1.7% in the quarter. Rental rates went from $5.52 to $5.31 during that time. At the end of the quarter, there was 930,500 square feet underway for future delivery.
V
Visalia/Porterville
With no new industrial space being delivered to the market, and positive 83,592 square feet of net absorption, Visalia/Porterville’s vacancy rate went from 2.6% to 2.4% in the quarter. Rental rates went from $5.41 to $4.88 during that time. At the end of the quarter, there was 30,744 square feet underway for future delivery.
W
Washington
The Washington industrial market saw vacancies fall and rental rates increase from the second quarter 2018 to the third quarter 2018. The overall vacancy rate currently sits at 5.5%, from 5.6% in the previous quarter. Rental rates ended the quarter at $9.13 per square foot, from $9.06 in the previous quarter. There was a total of 791,857 square feet that delivered in the quarter, with 13,031,987 square feet still under construction at the end of the quarter.
West Michigan
The West Michigan industrial market saw vacancies rise and rental rates increase from the second quarter 2018 to the third quarter 2018. The overall vacancy rate currently sits at 1.8%, from 1.7% in the previous quarter. Rental rates ended the quarter at $4.34 per square foot, from $4.22 in the previous quarter. There was a total of 28,675 square feet that delivered in the quarter, with 1,134,933 square feet still under construction at the end of the quarter.
Westchester/So Connecticut
The Westchester/So Connecticut industrial market saw vacancies fall and rental rates increase from the second quarter 2018 to the third quarter 2018. The overall vacancy rate currently sits at 4.8%, from 5.1% in the previous quarter. Rental rates ended the quarter at $9.98 per square foot, from $9.84 in the previous quarter. There was a total of 28,033 square feet that delivered in the quarter, with 1,649,548 square feet still under construction at the end of the quarter.
Wichita
The vacancy rate remained unchanged in Wichita in the third quarter. With 5,940 square feet in deliveries, and positive 39,072 square feet in net absorption, the vacancy rate held at 4.0%, the same rate reported in the previous quarter. The market had 102,336 square feet under construction at the end of the quarter, and rental rates stood at $5.01 per square foot.
Wilmington
The Wilmington industrial market saw vacancies fall and rental rates decrease from the second quarter 2018 to the third quarter 2018. The overall vacancy rate currently sits at 8.4%, from 8.7% in the previous quarter. Rental rates ended the quarter at $4.11 per square foot, from $4.16 in the previous quarter. There was a total of 14,250 square feet that delivered in the quarter, with 32,350 square feet still under construction at the end of the quarter.
Y
Yakima
With no new industrial space being delivered to the market, and negative (3,000) square feet of net absorption, Yakima’s vacancy rate went from 1.2% to 1.3% in the quarter. Rental rates went from $5.31 to $5.25 during that time. At the end of the quarter, there was 33,250 square feet underway for future delivery.
Youngstown/Warren/Boardman
With no new industrial space being delivered to the market, and positive 459,656 square feet of net absorption, Youngstown/Warren/Boardman’s vacancy rate went from 9.1% to 8.3% in the quarter. Rental rates went from $3.01 to $3.03 during that time. At the end of the quarter, there was 350,000 square feet underway for future delivery.
Inventory & Development Graphs
Figures at a Glance
Leasing Activity
Sales Activity
Terms & Definitions
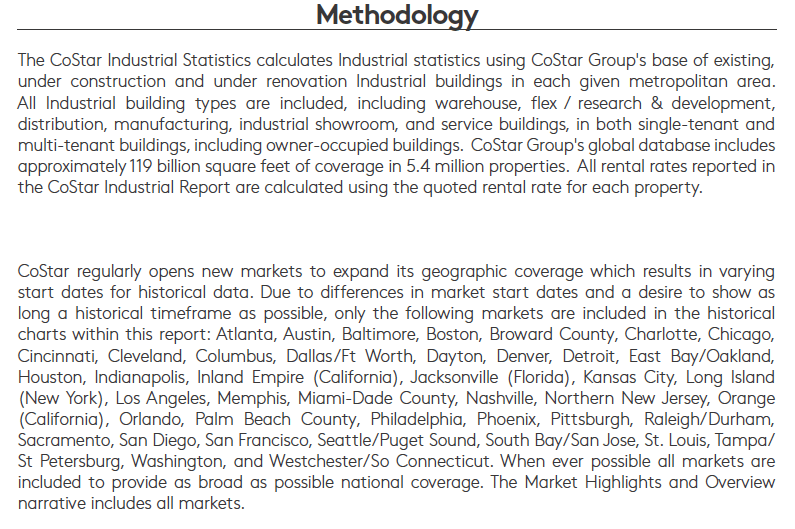
Methodology